1 Introduction
A reduced volume of blast furnace slag as a feedstock for cement production can be expected in Europe as result of efforts to reduce CO2 emissions from steel production. In this respect, a waste material stream that has so far been little used is becoming the focus of greater interest: electric arc furnace slags. Large quantities of manganese-silicon-iron slags (MnSiFe slags), e. g., are produced as a by-product in the manufacture of manganese-silicon alloys (MnSi alloy). So far, these slags are mainly dumped. (1). The global production of MnSi alloys was about 12.80 M t in 2014 (2). Typically, slag formation is about 1.2 to 1.4 t per ton of MnSi alloy produced (1), so a waste stream of about 15.4 to 17.9 M t/a can be used.
The European production sites are mainly located in Norway and Sweden, partly due to favorable energy costs and logistical links. The MnSiFe slags produced there have residual contents of up to 14 % Mn. The price development of both, manganese ore and energy raw materials, as well as the shortage of dump space, are increasingly raising the attention on the development of the raw material potential of MnSiFe slags (3). A high potential is seen both in the utilization of manganese remaining in the slag and in the utilization of the silicate phase (4).
Due to the large material heterogeneity, resulting from complex thermodynamic processes, the recovery of manganese represents a major challenge. So far, studies on manganese recovery have mainly focused on processes for separation of valuable materials from MnSiFe slags by leaching (5, 6, 7). However, hazards to the environment must be considered, which may arise in particular from the large-scale use of acids. However, only a few authors deal with physical separation processes (8). The deeper analysis of the potentials for the application of physical separation processes is therefore the subject of the investigation presented here.
In physical separation processes, MnSiFe slags are usually first pre-crushed and pre-concentrated as far as possible by sorting in order to feed them to downstream processes. After the separation of parts of the Mn phase, part of the silicate phase can be returned to the electric furnace as slag former, if necessary. In order to achieve the most efficient and complete recovery of the manganese in this way, the comminution has to ensure not only a reduction of the particle size, but also a sufficient liberation of the target phases. These processes are controlled by the fracture mechanisms, which are influenced by the textural attributes of the material. Mechanical properties of the individual slag phases, such as strength, toughness and brittleness, have a great influence on the fracture behavior. However, their influence has been insufficiently discussed in the literature so far (9).
The study presented here includes an initial characterization of the material by scanning electron microscope (SEM), followed by mechanical testing of the identified slag-forming phases, including strength, hardness, and toughness. Particular emphasis is placed on the analysis of structural and mechanical properties of manganese containing inclusions.
2 Slag phases and their characterization approaches
2.1 Slag material
Samples of MnSiFe slag from an electric arc furnace (EAF) plant at the Kvinesdal mill were provided by the Eramet Group, Norway. The rather coarse material was first pre-crushed on a crusher from Metso Outotec in Tampere/Finland. Due to segregation processes during uncontrolled cooling, the samples are heterogeneous (Figure 1).
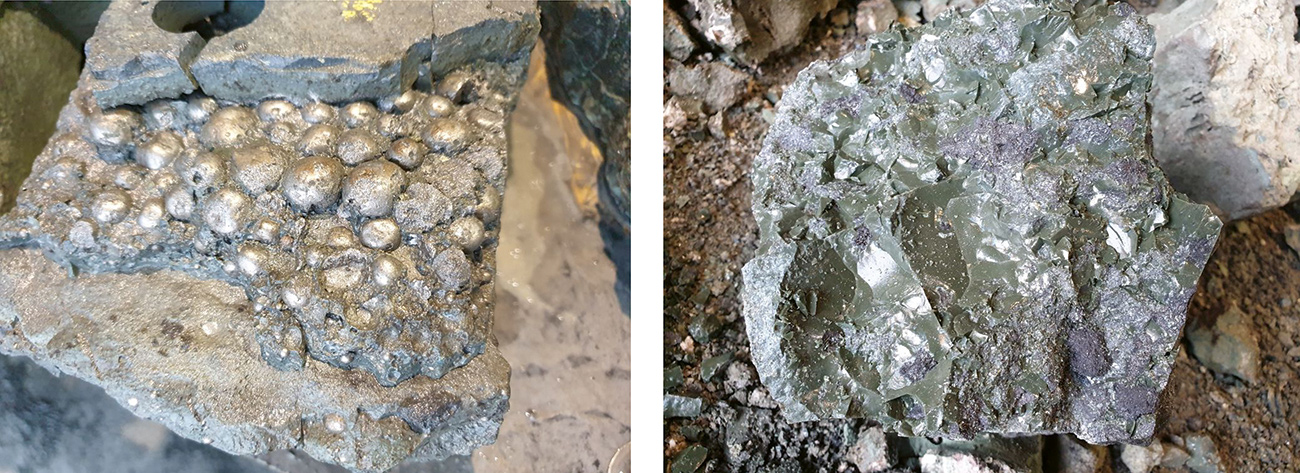
Fig. 1. Samples of MnSiFe slags: left: large slag inclusions, right: amorphous slag material. // Bild 1. Proben von MnSiFe-Schlacken: links: große Schlackeneinschlüsse, rechts: amorphes Schlackenmaterial. Photos/Fotos: Juuso
They have a mass fraction of 5 to 7 % Mn and inclusions of max. 16 mm in size. Two batches were analyzed. A first small sample of 13.7 kg was used for a preliminary characterization of the material including phase identification using a Mineral Liberation Analyzer (MLA) from FEI Company and the first micro-mechanical investigations. A bulk sample of about 3 t of a slag cast later was first homogenized and divided into representative individual samples. The test results of the first sample were compared with the results of the second sample to obtain an initial impression of possible variations in slag composition and properties between different casts.
The precrushed particles of the first sample were classified into five classes according to the size of inclusions and porosity after visual evaluation (Figure 2).
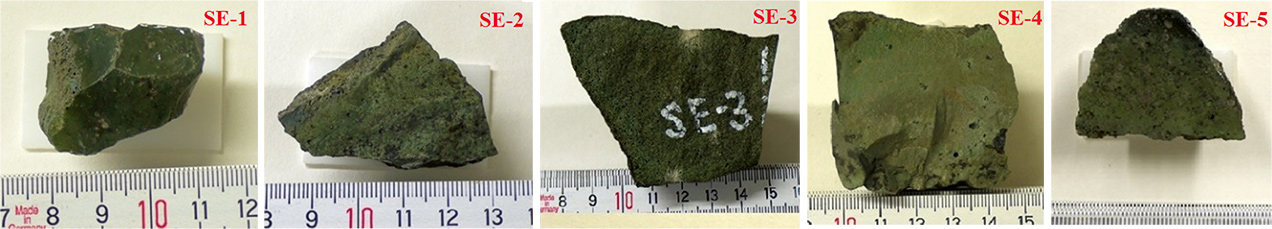
Fig. 2. MnSiFe slag particles: Five classes: SE-1, SE-2, SE-3, SE-4, SE-5. // Bild 2. MnSiFe-Schlacke-Partikel: Fünf Klassen: SE-1, SE-2, SE-3, SE-4, SE-5. Photos/Fotos: IART
2.2 Characterization approaches
A systematic characterization was conducted using different mineralogical techniques to perform a representative mineralogical study for the heterogeneous material. Polished samples from the above five classes were analyzed under the optical microscope and by SEM. Each sample was also prepared for MLA analysis software. Orthogonal thin sections were analyzed by quantitative microstructure analysis (QMA). As mentioned earlier, one of the important features of this material is the presence of MnSiFe inclusions. Therefore, the study included analyses of the density and magnetic susceptibility of these inclusions. These applied analytical techniques are presented in more detail below.
2.2.1 Point load test (PLT)
The point load test involves stressing two approximately parallel surfaces of a sufficiently large particle by two conical tools with rounded tips until the particle fractures between the stressing points. The fracture force and the newly created fracture surface are then put into a relation, considering the contact distance D, to determine the IS strength parameter. Details on the design of the test tools, the test procedure and the calculation of the point load indices IS can be found in the ISRM guidelines (10).
The strength index depends strongly on the overall size of the specimen. This effect, which can also be observed in other methods for determining strength, e. g., uniaxial compression test, is generally referred to as the scale effect in rock mechanics. Since the specimen size affects the strength index, the strength indices of rock pieces of different dimensions must be converted to a “standard specimen” with a standard diameter De = 50 mm. The resulting strength index, thus normalized to a standard specimen size, is designated IS(50). Further details for the conversion of the IS-value to the comparative IS(50)-value can be found, e. g., in Raatz (11). Broch and Franklin (12) used an idealized set of curves that should allow any single value for IS at any distance D to be reduced to a standard IS(50)-value.
A major advantage of the PLT method over other widely used test methods for determining unconfined compressive strength is the limited requirements for the preparation of the rock specimens. The point load test can be performed on irregularly shaped parts as well as on core samples. The PLT can therefore also be performed quickly and easily with a portable testing device on site or in laboratory. Thanks to the low effort required for sample preparation, a larger number of comparative samples can be tested at reasonable expense, thus enabling statistical validation of the value obtained.
In this case, the strength index IS(50) of the available MnSiFe slag samples was determined using a PLT testing device from WILLE-Geotechnik. The measuring range of this instrument is between 0 and 250 bar. Figure 3 shows the IS(50)-values of the MnFeSi slag determined by means of PLT tests at the Institute for Processing Machines and Recycling Systems Technology (IART) of the TU Bergakademie Freiberg, Freiberg/Germany.
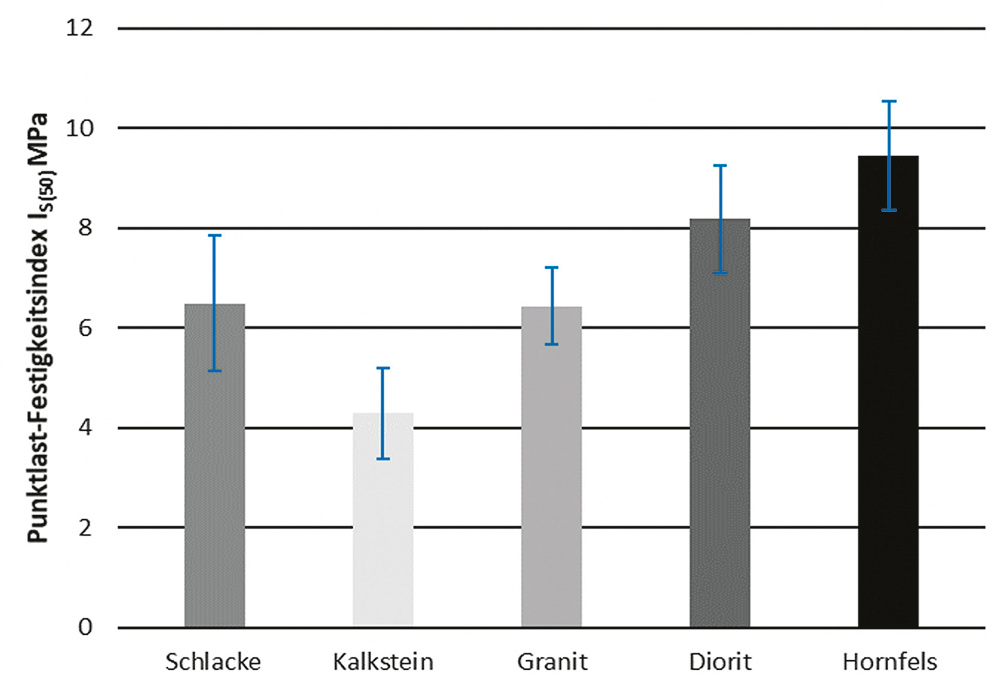
Fig. 3. Point load strength index of slag and selected reference rocks. // Bild 3. Punktlast-Festigkeitsindex von Schlacke und ausgewählten Referenzgesteinen. Source/Quelle: IART
The compressive strength of the investigated MnSiFe slag is quite high and reaches the compressive strength of granite. It should be noted, however, that the scatter of the measured values is higher than for the natural rocks investigated.
2.2.2 Quantitative Microstructural Analysis (QMA)
Generally, natural rocks, ores, but also slags consist of different phases, which may differ in their technological properties. These phases largely determine the texture and structure of a mineralogical structure and thus its mechanical properties. Their volume fraction is referred to as mode. Quantitative microstructural analysis, Popov (13, 14, 15), is a suitable method for the quantitative description of these properties. The quantitative information obtained can provide important support to plant designers, e. g., in the selection of suitable comminution machines, the determination of their operating parameters, and finally the size of the crushed particles. At the microscopic scale, the phases that compose the MnSiFe slag in this example are first detected. This can be realized by reflected or transmitted light microscopy, but also by modern methods such as MLA.
The starting point of the QMA are images of the thin sections of individual samples. Three orthogonally oriented thin sections or polished sections are prepared from each handpiece and examined stereologically. The microscopic images are evaluated in successive steps by point counting, line analysis (the number of intersections per unit length in different directions), and area analysis. Considering the 2-dimensional information of the three thin sections or sections of a hand sample, it is now possible to synthesize a 3-dimensional model of the microstructure under investigation by means of a mathematical transformation and approximation.
Based on the information thus obtained, microstructural properties can be quantified in the form of characteristic values oriented to geological terms. Characteristic data of the mode (volume fractions of the phases), the phase- and rock-related characteristic data of the texture (size, shape, roughness) as well as the structure (orientation, distribution, degree of space filling) are used to characterize the mineral structures (Table 1).
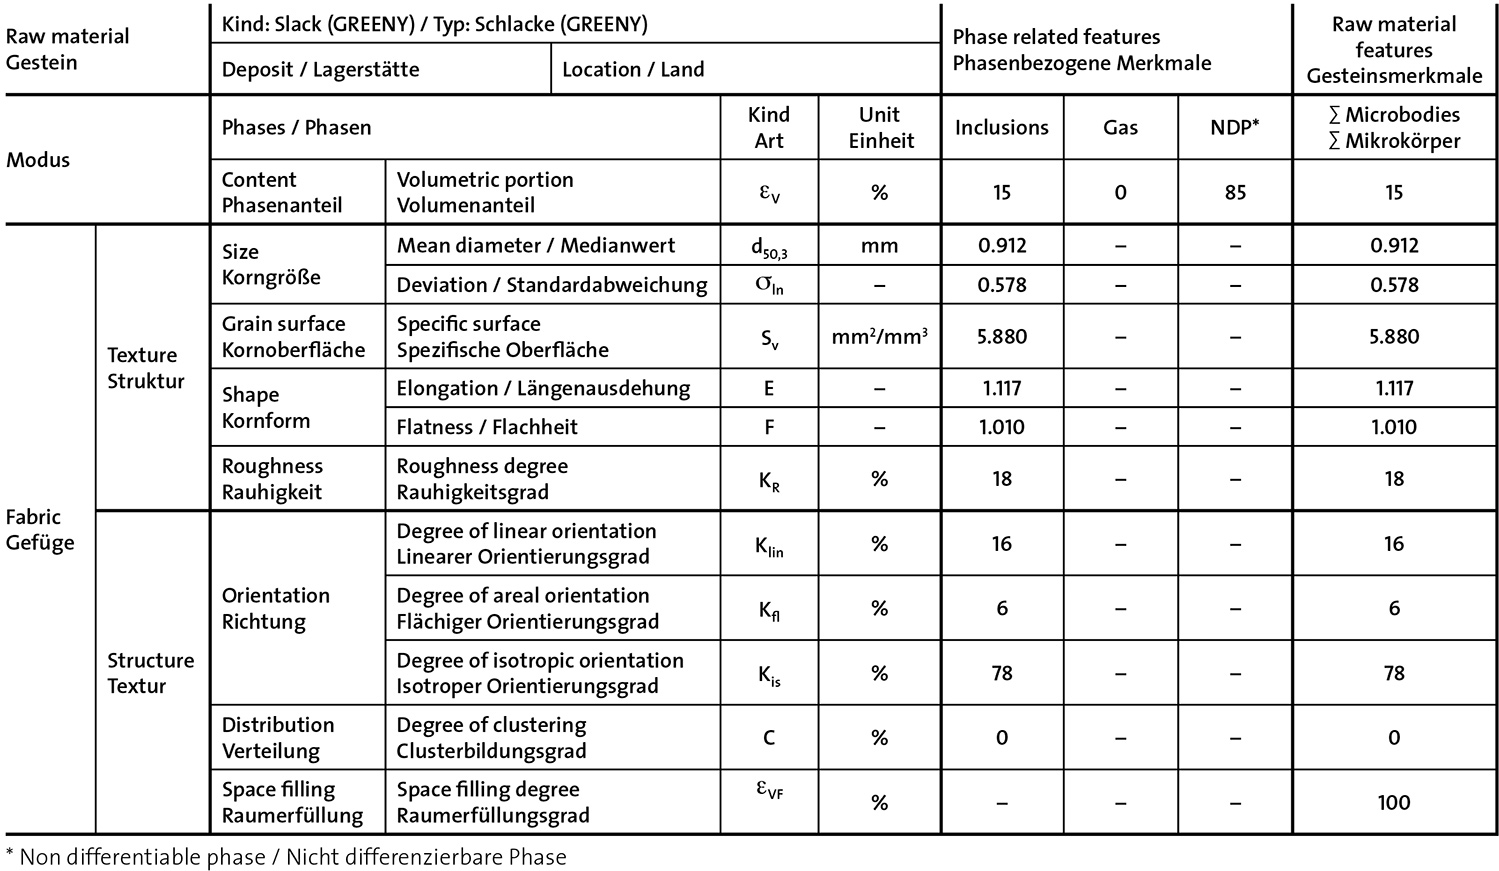
Table 1. QMA characterization of MnSiFe slag (analyzed by optical microscope). // Tabelle 1. QMA-Charakterisierung der MnSiFe-Schlacke (mittels Lichtmikroskop analysiert). Source/Quelle: IART
Additionally, other important data for slag processing are the particle shape of the crushed product, e. g., for sorting. The particle shape can be predicted by examining the isotropic degree of orientation using the QMA method. An isotropic orientation degree of more than 75 % indicates that cubic particle shapes are to be expected during comminution. In the case of the analyzed material, the isotropic degree of orientation is 78 %. Consequently, cubic particles are more likely to be expected.
Another important parameter that can be defined with this method is the size of the inclusions, the representative determination of which by means of other methods, e. g., SEM-based MLA, requires greater effort, since by means of MLA the various phases of the inclusions are each initially considered separately.
2.2.3 Mineral Liberation Analysis
The Mineral Liberation Analyzer (MLA) from FEI Company – now part of Thermo Fisher Scientific Inc. – combines an automated SEM with multiple Energy Dispersive X-Ray Detectors (EDS) to automatically acquire and jointly analyze image and elemental spectral information. SEM analysis of the samples enables automated analyses based on the evaluation of backscattered electron images (BSE) and the acquisition of energy dispersive X-ray spectra of the particles visible in the BSE imaging mode (16).
MLA analysis of MnSiFe slag was performed on an MLA 650F system equipped with a field emission source and two Bruker XFlash SDD-EDS X-ray spectrometers. The grayscale calibration of the backscattered electron (BSE) image was calibrated with epoxy resin as the background (BSE gray level < 20) and gold (pin in RDI standard block) as the upper limit (BSE gray level about 250). The EDS X-ray spectrometers were calibrated with copper (pin in the RDI standard block). Several measurement modes are available in the MLA expert software, each calibrated for specific applications. In this study, the measurement mode GXMAP, i. e. grain X-ray mapping, was used. GXMAP uses X-ray mapping to identify phases that cannot be segmented by BSE gray levels alone.
The slag types, previously divided into five classes, were analyzed using the MLA technique (Figure 4a). For this purpose, the samples were embedded in epoxy resin. The ground surfaces of the resulting sections were coated with carbon and examined by SEM-EDS to identify the chemical composition and texture of the samples in this way as well (Figure 4b).
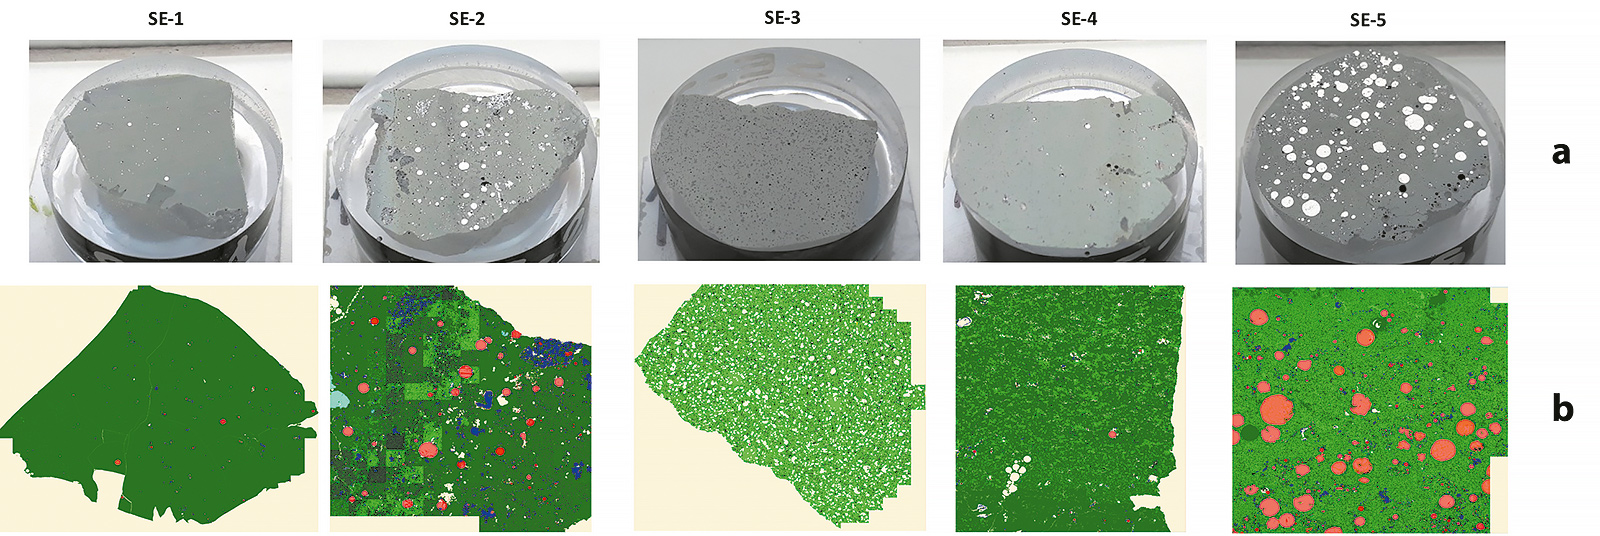
Fig. 4. Specimens of the five classes: a. polished sections, b. phase images of the same polished sections observed by MLA. // Bild 4. Proben der fünf Klassen: a. Anschliffe, b. mittels MLA ermittelte Phasenbilder der entsprechenden Anschliffe. Source/Quelle: IART
According to a previously performed calibration with a standard spectrum list specified from representative samples, the collected ED spectra are determined for all samples and a mineral list is created. The standard spectra provided by the manufacturer in a database contain a large number of spectra of rock-forming minerals, but hardly any suitable for the analysis of the slags, the mineral list was adapted to the specific requirements for the evaluation of the samples at hand. Overall, different phases were detected. Individual phases could be detected in several sample classes. However, as expected, the respective phase volume fraction differed from class to class. In principle, the phases can be summarized into the following two main groups: phases with Mn-rich inclusions and Mn-poor matrix phases.
After the completion of the preliminary investigations with the small sample obtained first, further investigations were carried out with samples obtained from the large sample. Following a representative sample split, nine specimens were selected after visual sampling, which were again embedded, and ground as described above. Due to the small specimen size, several specimens could be embedded together and then processed and analyzed. The assignment of the nine specimens to the individual castings was purely random. Figure 5 shows the specimens including the numbering.
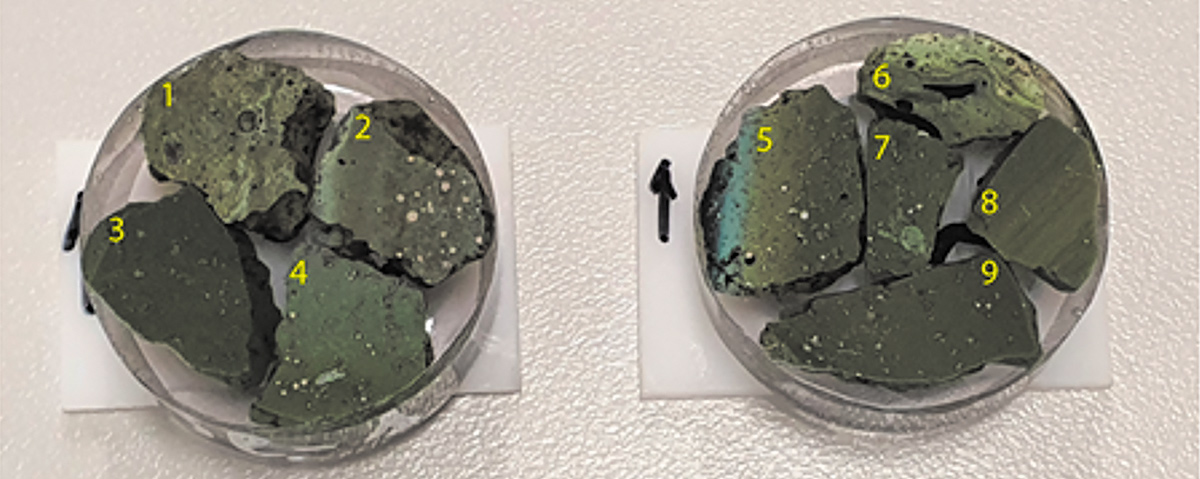
Fig. 5. Bulk sample specimens including numbering (1 to 9). // Bild 5. Probestücke einschließlich der Nummerierung (1 bis 9). Photo/Foto: IART
The MLA analysis of the specimens 1 to 4 should show to what extent the small and large sample were comparable and how large the variability within a sample is.
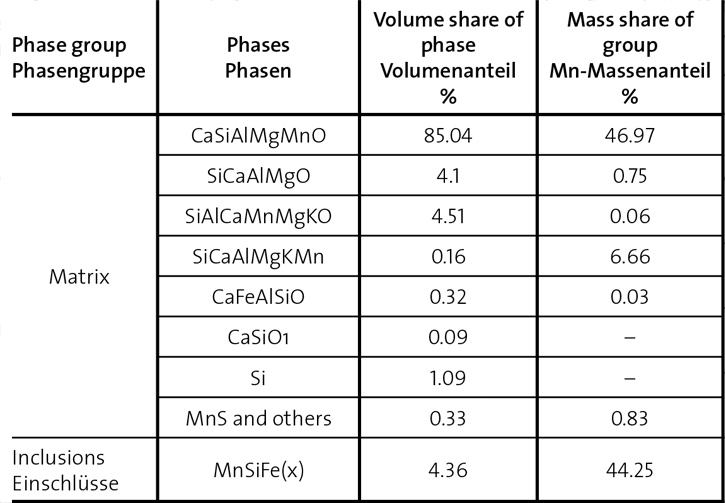
Table 2. Composition of selected slag phases. // Tabelle 2. Zusammensetzung ausgewählter Schlacke-Phasen. Source/Quelle: IART
Table 2 shows the mean composition of the samples. A total of 14 different phases was detected. It should be emphasized that 45 % of the total manganese contained is concentrated in only 4.4 % of the slag volume. The remaining manganese (55 %) is bound in the matrix 95.6 % in rather complex phases (Figure 6) .
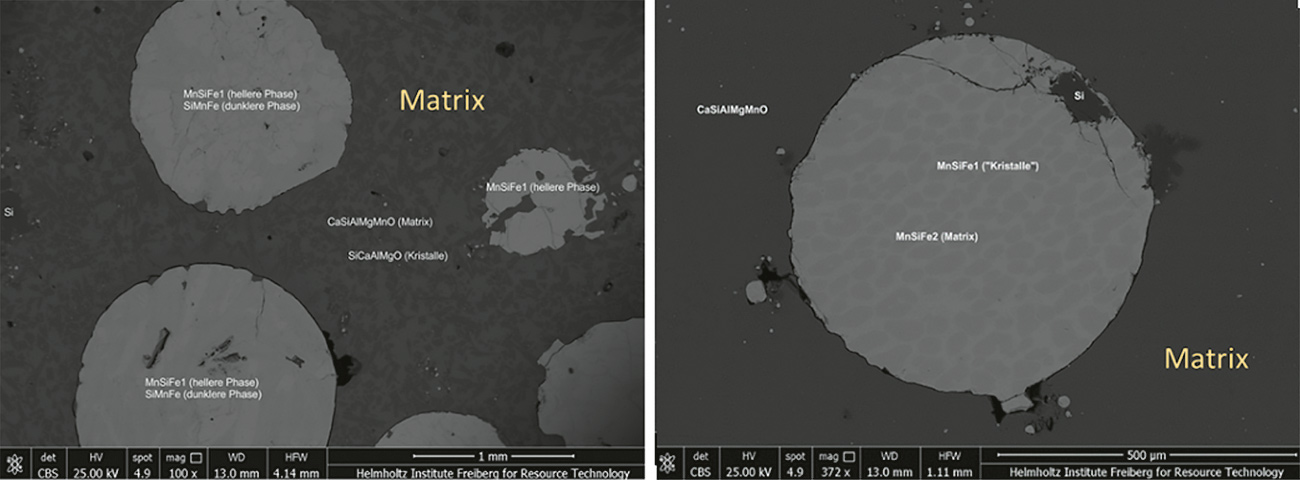
Fig. 6. SEM examination for the phases of inclusions and matrix (small sample, sample SE-1, rounded inclusions). // Bild 6. SEM-Untersuchung für die Phasen von Einschlüssen und Matrix (Kleinprobe, Probe SE-1, abgerundete Einschlüsse). Source/Quelle: IART
It therefore seems obvious to look for ways to separate the inclusions with the high Mn content as efficiently as possible. On the one hand, this would allow an important valuable material to be recovered in high concentration for the metallurgical process. On the other hand, the remaining matrix material would be cleaner and could thus be better reused as a building material.
For this purpose, the structure of the slags will first be investigated in more detail. The samples contain a heterogeneous distribution of MnSiFe inclusions within a crystalline-amorphous slag matrix, which also contains traces of metallic Si quantity in a basic substance of complex silicate phases (CaSiAlMgMnO, SiAlCaMnMgKO and SiCaAlMgO). The iron content in the inclusions reaches 95 % of the content in the total sample (Table 3).
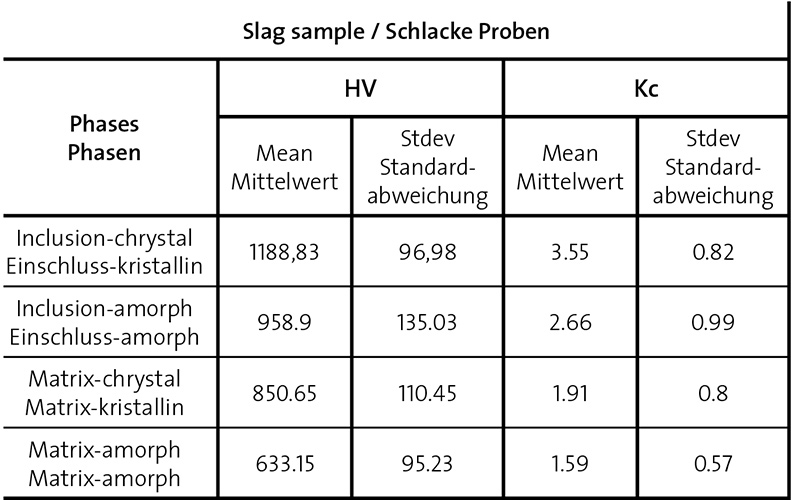
Table 4. Vickers hardness and fracture toughness and associated standard deviations for different inclusion and matrix phases. // Tabelle 4. Vickers-Härte und Bruchzähigkeit sowie zugehörige Standardabweichungen für verschiedene Einschluss- und Matrix-Phasen. Source/Quelle: IART
This high concentration suggests the consideration of using the iron as a tracer for further processing steps, possibly even investigating the possibility of magnetic separation of previously digested inclusions. The mineralogy of the material of the bulk sample as a total is largely in concordance with that of the previously investigated small sample (Figure 6).
Bulk sample specimen 1 (numbering referred to Figure 5) shows a highly porous texture with the MnSiFe(x) phase partially disseminated in the matrix (Figure 7a).

Fig. 7. Microscope images of different phases and textures of the bulk sample: a. MnSiFe(x) phase, partially disseminated in the matrix; b. round inclusions of different sizes; c. round inclusions and homogeneous fragments. // Bild 7. Mikroskopaufnahmen verschiedener Phasen und Texturen der Großprobe: MnSiFe(x)-Phase, teilweise in der Matrix gelöst; b. runde Einschlüsse unterschiedlicher Größe; c. runde Einschlüsse und homogene Fragmente. Source/Quelle: IART
Small crystalline MnS inclusions are also visible in spectral analysis (Figure 8).
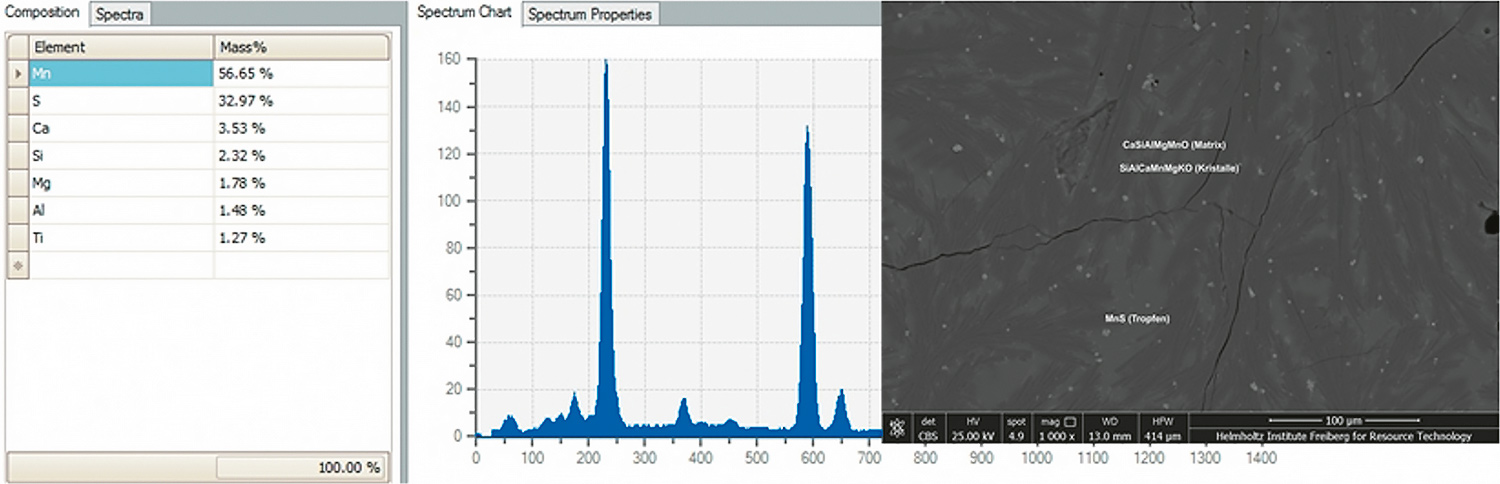
Fig. 8. Spectral properties of a MnS inclusion (Microscope image). // Bild 8. Spektraleigenschaften eines MnS-Einschlusses (Mikroskopaufnahme). Source/Quelle: IART
Specimen 2 contains large spherical inclusions (MnSiFe phases) consisting of two or even three MnSiFe phases (MnSiFe1, MnSiFe2 and SiMnFe). This specimen belongs to the slag part with the highest concentration of inclusions. Here, the MnSiFe phases form intergrowths ranging in size from 80 to 400 µm (Figure 7b).
The specimens 3 and 4 are evaluated as the most characteristic ones of the bulk sample. The specimens consist mainly of an amorphous matrix containing round inclusions and some homogeneous fragments (Figure 7c). Moreover, the inclusions are smaller, between 20 and 300 µm. Also here a MnS phase with a size < 10 µm can be detected.
Based on these data, it can also be noted that 93 % of the MnSiFe inclusions can be attributed to the MnSiFe1-MnSiFe2 association (defined as Inclusion association 1). If the SiMnFe phase is also taken into account, 97 % is reached (defined as Inclusion association 2). Inclusion association 1 is the one that contains most of the total Fe. In the matrix phases, Fe is hardly associated with Mn contents (Table 3). SEM observation also identifies an amorphous and crystalline phase in each inclusion (Figure 9).
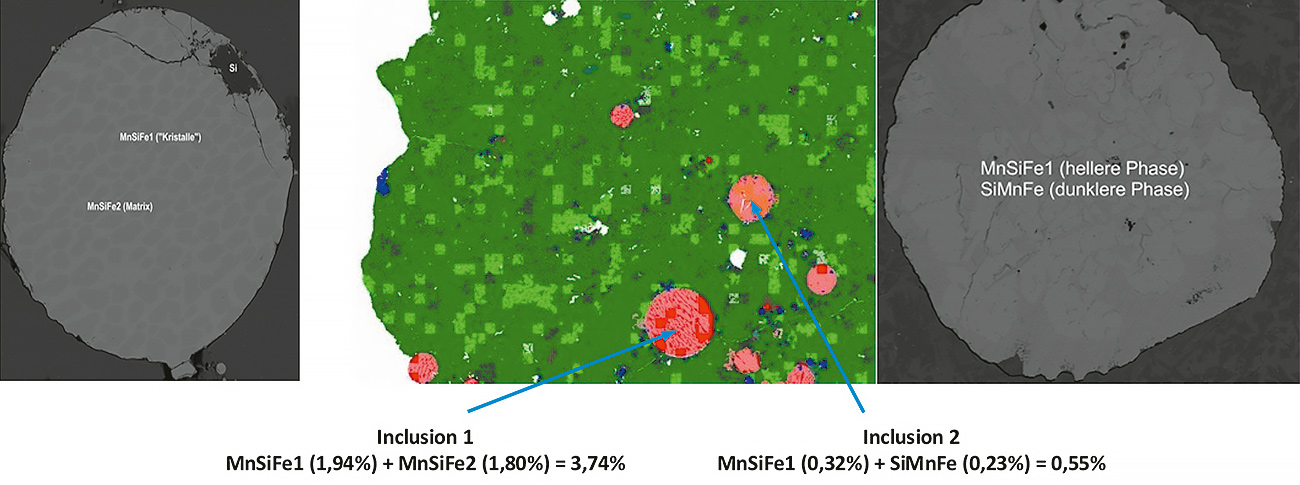
Fig. 9 . Inclusion composition: left: Inclusion association 1, right: Inclusion association 2. // Bild 9. Einschlusszusammensetzung, links: Einschluss-Assoziation 1, rechts: Einschluss-Assoziation 2. Source/Quelle: IART
2.2.4 Determination of Vickers hardness (HV) and fracture toughness
After the previous investigations showed that the inclusions contained in the slag are characterized by an Mn content substantially above-average, the following questions arise:
- Do the strength properties of inclusions and matrix differ sufficiently, so that the slag particles can be stressed by suitable comminution processes in such a way that matrix and inclusions are crushed into different particle size classes by selective comminution in order to subsequently enable pre-concentrating by sieving with the lowest possible loss of valuable material?
- Is there any difference between inclusions and matrix in susceptibility or density that allow efficient sorting?
Vickers hardness measurements have proven suitable as a means of determining strength differences at the mineral level. The hardness of a material is generally defined as its resistance to local deformation. Tests based on the material’s resistance to indentation are used to determine it. Typically, this involves pressing a hard indenter of defined geometry into the material surface with a known load.
The pyramid-shaped indenter with an interface angle of 136° is pressed into a specimen with a defined test force (Figure 10) to determine the Vickers hardness (HV) according to ISO 6507.
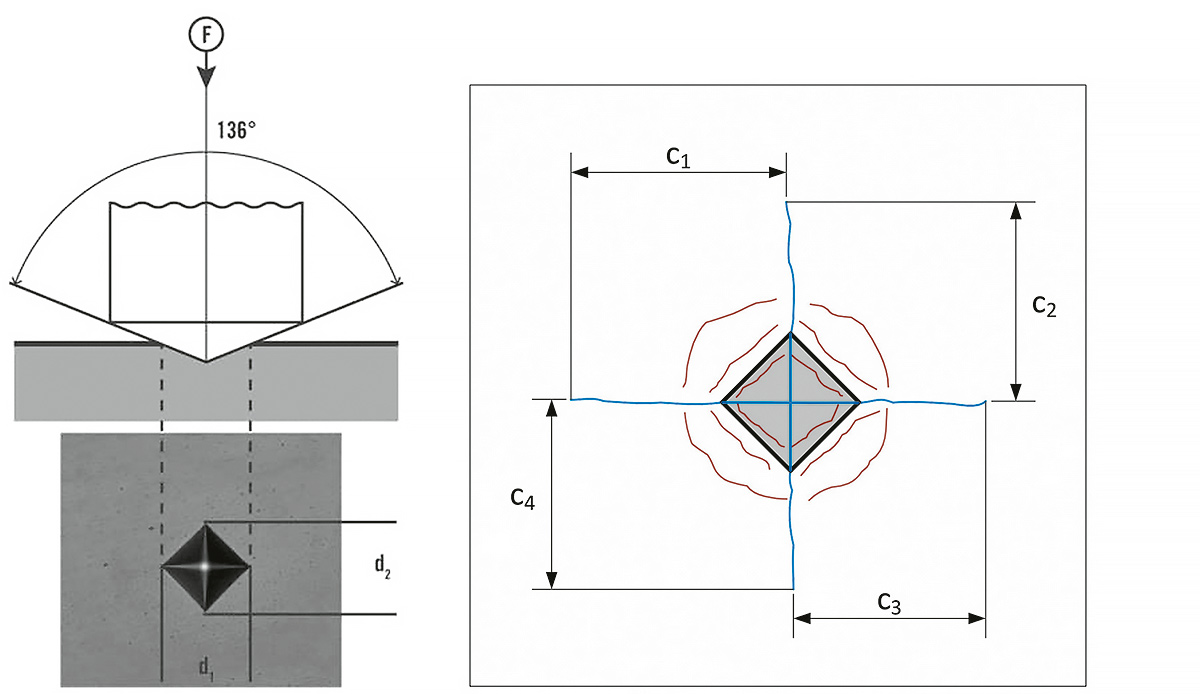
Fig. 10. Representation of the relevant parameters of the Vickers hardness measurement method. // Bild 10. Darstellung der relevanten Parameter des Vickershärte-Messverfahrens. Source/Quelle: IART
The Vickers hardness results from the quotient of the applied test force and the area of the remaining indentation on the specimen. To calculate the surface area of the remaining pyramid-shaped indentation, the mean value of the two diagonals d1 and d2 is used, since the base area of Vickers indentations is often not exactly square (Figure 10). Soft materials often give a larger indentation and hard materials a smaller one. The Vickers hardness range can be found in the standard (ISO 6507). Depending on the test load and the specimen material used, the HV value is between 1 and 3,000 HV.
The lengths c1-c4 of the cracks developing mostly at the corners of the indentation can be used to qualitatively and quantitatively characterize the fracture toughness. The fracture toughness is measured to explain the resistance to crack propagation. Theoretical models for estimating fracture toughness KIC are based on a strength of materials theory approach. Thereby, stress intensity factors are calculated for radial-median cracks – also known as Palmqvist cracks – considering a simple crack geometry (17, 18).
The results of the investigation of hardness and fracture toughness of different slag phases by Vickers hardness test are shown in Table 4.
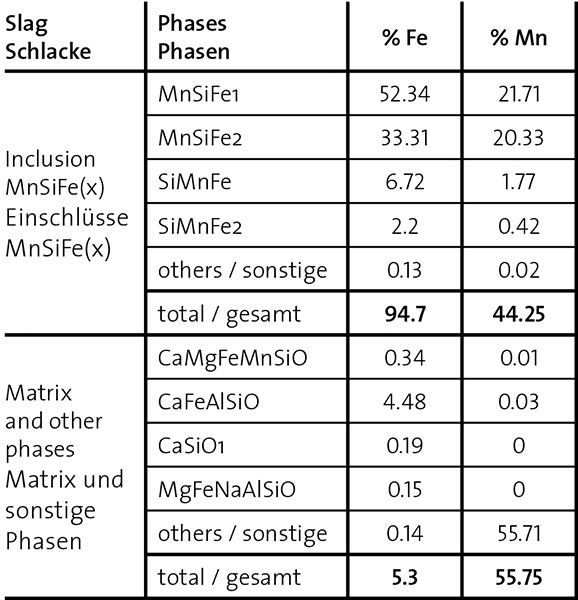
Table 3. Fe and Mn share of of Fe and Mn in selected phases of the inclusion and matrix. // Tabelle 3. Fe- und Mn-Anteil ausgewählter Phasen von Einschlüssen und Matrix am Gesamtgehalt. Source/Quelle: IART
The measurements were carried out using Micro Vickers hardness tester, model Shimadzu HMV-G21DT.
Figure 11 shows that there are significant differences in hardness and fracture toughness between inclusions and matrix. The crystalline phases show higher values for both inclusions and matrix.
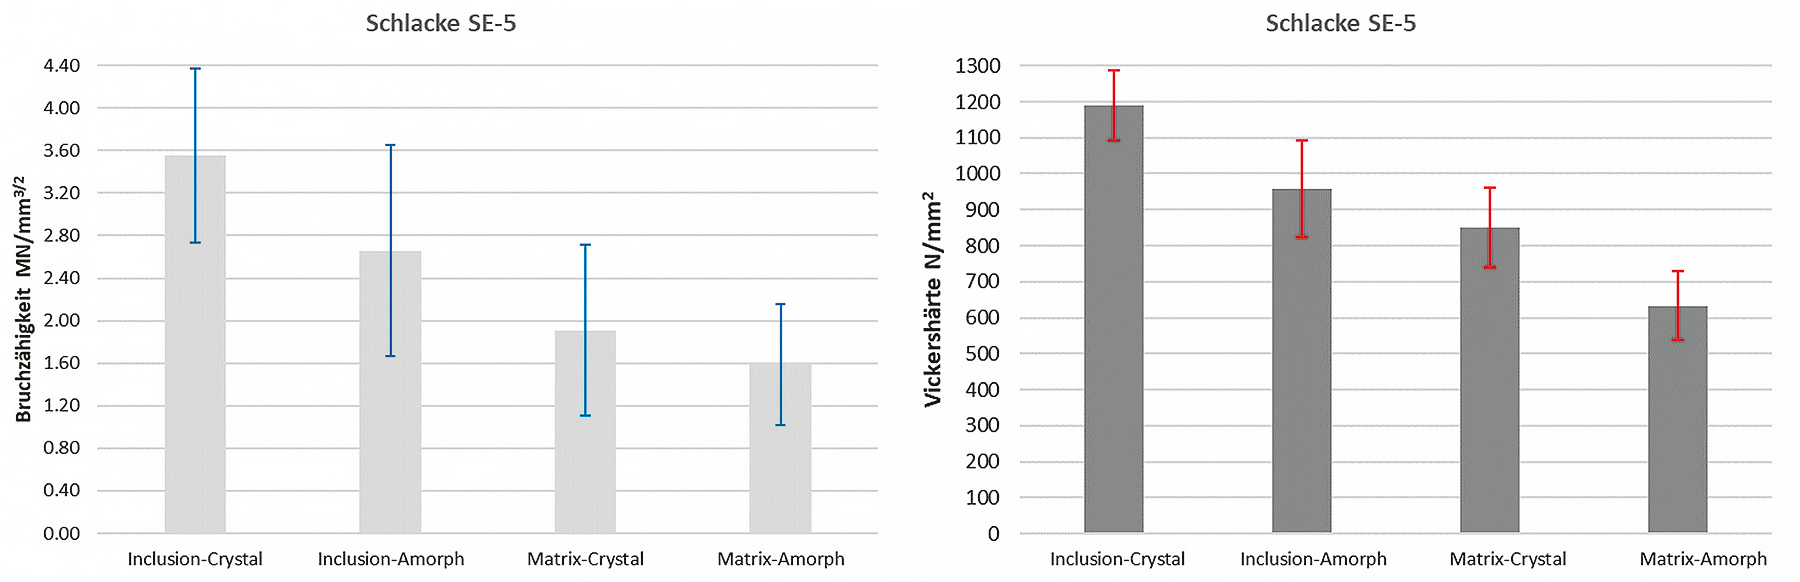
Fig. 11. Fracture toughness (left) and Vickers hardness (right) of the investigated slag phases. // Bild 11. Bruchzähigkeit (links) und Vickershärte (rechts) der untersuchten Schlackephasen. Source/Quelle: IART
2.2.5 Density of selected slag phases
Macroscopically, inclusions and matrix were identified from fractions < 12.5 mm of the bulk sample for a density and magnetic susceptibility study. The inclusions were visually classified as type A, rounded inclusions, and type B or B’, non-rounded inclusions/fractions (Figure 12). By hand picking, 13 g, 10 g, and 6 g were collected respectively for density difference and magnetic susceptibility tests.
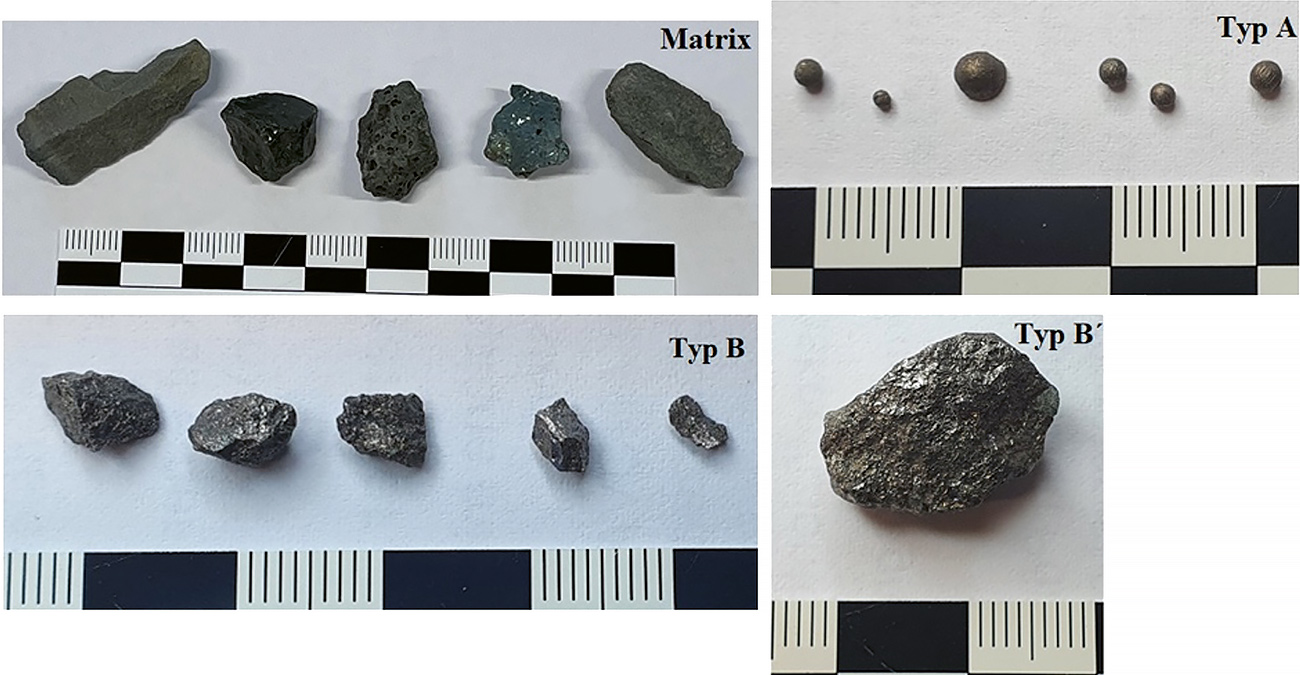
Fig. 12. Matrix and inclusion types. // Bild 12. Klassen von Einschlüssen. Photos/Fotos: IART
The density was determined using a Hubbard pycnometer. This consists of a bottle body and a cap containing a capillary. For proper density determination, it was necessary to remove air pockets (pore space open pores) by using a vacuum chamber. Each density measurement was performed three times for each sample. The measurement was performed at 20 °C room temperature.
It was found that the densities of the inclusions type A, B and B’ with values of 5.77 g/cm3, 5.93 g/cm3 and 5.79 g/cm3, respectively, are about twice as high as those of the matrix with 2.86 g/cm3 (Figure 13).
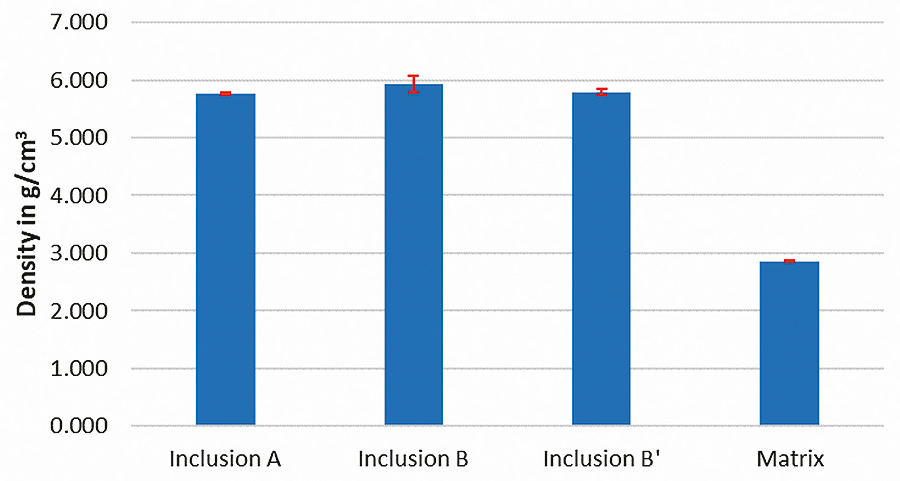
Fig. 13. Densities of inclusions and matrix. // Bild 13. Rohdichten von Einschlüssen und Matrix. Source/Quelle: IART
This suggests considerable potential for density sorting to separate the valuable inclusions.
2.2.6 Susceptibility of selected phases
Magnetic susceptibility is a petrophysical parameter and is controlled by the type and amount of magnetic mineral phases contained in a mineral material. Based on its magnetic properties, material can be classified as paramagnetic, diamagnetic and ferromagnetic. Due to the exclusive presence of Fe as a ferromagnetic material in the inclusions, it was decided to perform an analysis to determine whether the corresponding magnetic properties of the phases show sufficiently large differences to envisage magnetic separation after digestion.
The measurements were performed using a magnetic susceptibility scale, model MSB MK II. Three representative subsamples of each material (inclusion A, B, B’ and matrix) were analyzed. The measurements were repeated three times each. Figure 14 shows the average susceptibility data obtained for each of the samples.
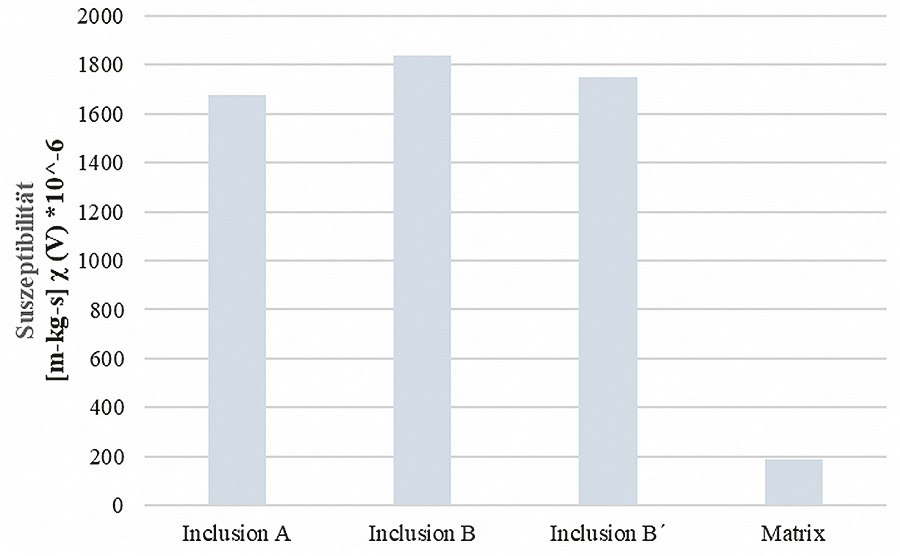
Fig. 14. Susceptibility of inclusions and matrix. // Bild 14. Suszeptibilität von Einschlüssen und Matrix. Source/Quelle: IART
The columns indicate a significant susceptibility difference between matrix and inclusions, which should be amenable as a sorting characteristic.
3 Summary and conclusions
The results of the study obtained by a number of investigation methods and presented here demonstrate, how a metallurgical residual material currently disposed of as waste can be systematically investigated with an emphasis on technological recovery options.
The differences between inclusions and matrix, which were determined in the course of these investigations and which can be used for the recovery of a significant amount of the Mn content from the MnSiFe slags investigated, are summarized in Table 5.
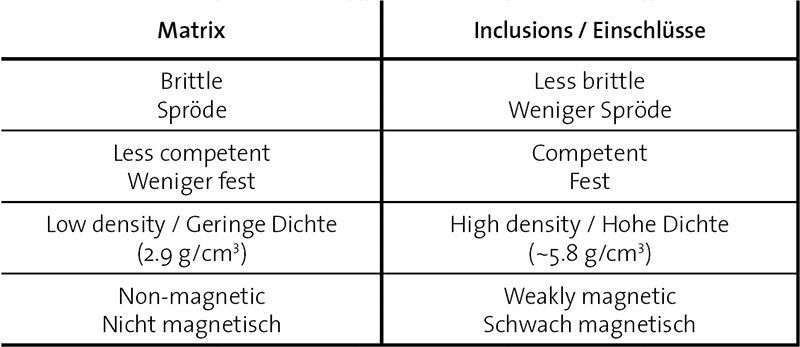
Table 5. Comparison of determined property differences of inclusions and matrix for the investigated MnSiFe slag. // Tabelle 5. Zusammenfassende Gegenüberstellung ermittelter Eigen-schaftsunterschiede von Einschlüssen und Matrix bei der untersuchten MnSiFe-Schlacke. Source/Quelle: IART
Taking into consideration the above assessment of the mineralogical and mechanical properties of the MnFeSi slags, the following conclusions can be obtained:
- An integrative analysis by QMA and MLA method and combination of the corresponding results of optical microscopy and SEM allow to determine not only the mineral phases present, but also textural features relevant to the understanding of the material.
- The micromechanical behaviour shows interesting results that should be evaluated in order to select the best type of stress for the comminution processes. Selective comminution should at least be investigated in terms of its technical feasibility.
- Through MLA studies it was found that there is a significant iron concentration in the inclusions that could be used as a tracer for the phases to be separated.
- There is an obvious difference in properties between the phases grouped as matrix and the phases grouped as inclusions, not only because of their magnetic behavior, but also because the density of the inclusions is twice higher.
- Although the susceptibility values for the inclusion phases are higher, these are nevertheless classified as being in the range of relatively low magnetism. Therefore, a strong-field magnetic separation is considered for their separation.
It can be concluded, that a thorow investigation of the physical properties of a material currently dumped as waste, reveals opportunities to recover valuable components from those materials and, in the best case, commercialize the various phases. The next step will the development of technical concepts that proof the correctness of the investigations and assumptions presented here.
Funding
This research is part of the Greeny project (Grinding Energy Efficiency) supported by EIT Raw Materials, grant project 18009, and by the European Union for the H2020 call.
References/Quellenverzeichnis
References/Quellenverzeichnis
(1) Kumar, S.; García-Triñanes, A.; Teixera-Pinto A.: Development of alkali activated cement from mechanically activated silico-manganese (SiMn) Slag. In : Cement and Concrete Composite, 2013, 40, pp. 7 – 13, doi :10.1016/j.cemconcomp.2013.03.026.
(2) Digernes, M. N.; Rudi, L.; Andersson, H.; Stålhane, S.; Wasbø, S. O.; Knudsen, B. R.: Global optimisation of multi-plant manganese alloy production. In : Computers & Chemical Engineering, 2018, 18, pp. 78 – 92, doi: 10.1016/j.compchemeng.2017.12.001.
(3) Clarke, C.; Upson, S. A.: Global portrait of the manganese industry – A socioeconomic perspective. In : Neurotoxicology 2017, 58, pp. 173 – 179, doi:10.1016/j.neuro.2016.03.013.
(4) Olsen, S. E.; Tangstad, M.; Lindstad, T.: Production of manganese ferroalloys. Tapir Akademisk Forlag, Trondheim/Norway, 2007; ISBN 9788251921916 8251921910.
(5) Ayala, J.; Fernández, B.: Recovery of manganese from silicomanganese slag by means of a hydrometallurgical process. In: Hydro-metallurgy 2015, 158, pp. 68–73, doi:10.1016/j.hydromet.2015.10.007.
(6) Malfliet, A.; Peys, A.; Di Maria, A.: Slag Valorisation Symposium, Mechelen, 2019, p. 442.
(7) Piatak, N. M.; Parsons, M. B.; Seal, R. R.: Characteristics and environmental aspects of slag: A review. In: Appl. Geochemistry 2015, 57, pp. 236 – 266, doi:10.1016/j.apgeochem.2014.04.009.
(8) Kim, B. S.; Jeong, S. B.; Jeong, M. H.; Ryu, J. W.: Upgrading of manganese from waste silicomanganese slag by a mechanical separation process. In: Mater. Trans. 2011, 52, pp. 1705 – 1708, doi:10.2320/matertrans.M2011114.
(9) Semsari Parapari, P.; Parian, M.; Forsberg, F.; Rosenkranz, J.: Characterization of ore texture crack formation and liberation by quantitative analyses of spatial deformation. In: Miner. Eng. 2020, 157, p 106577, doi:10.1016/j.mineng.2020.106577.
(10) ISRM – International Society for Rock Mechanics: Suggested method for determining point load strength. Commission on Testing Method. Working Group on Revision of the Point Load Test Method. Int. J. Rock Mech. Min. Sci. & Geo-mech. Abstr. 1985, Vol. 22, No. 2, pp. 51 – 60.
(11) Raaz, V.: Charakterisierung der Gesteinsfestigkeit mit Hilfe eines modifizierten Punktlastversuches. In: Z. geol. Wiss. 30, 2002, Nr. 3, S. 213 – 226.
(12) Broch, E.; Franklin, J. A.: The Point-Load Strength Test. Int. J. Rock Mech. Min. Sci. & Geomech. Abstr., 1972, Vol. 9, pp. 669 – 697.
(13) Popov, O.: Beitrag zur Mathematisch-Petrographischen Gefügecharakterisierung für die Beurteilung der Festgesteine hinsichtlich ihrer Aufbereitung und ihrer Produkteigenschaften. TU Bergakademie Freiberg, Freiberg/Germany, 2007.
(14) Popov, O; Lieberwirth, H.; Folgner, T.: Quantitative Charakterisierung der Festgesteine zur Prognostizierung des Gesteinseinflusses auf relevante Produkteigenschaften und Systemkenngrößen. Teil 1: Anwendung der quantitativen Gefügeanalyse. In: AT Miner. Process. 2014, 07 – 08, S. 76 – 88.
(15) Popov, O.; Talovina, I.; Lieberwirth, H.; Duryagina, A.: Quantitative Microstructural Analysis and X-Ray Computed Tomography of Ores and Rocks – Comparison of Results. In: Minerals, 2020, 10, pp. 1 – 18.
(16) Mwanga, A.: Test Methods for Characterising Ore Comminution Behavior in Geometallurgy. 2014.
(17) Rios, C. T.; Coelho, A. A.; Batista, W. W.; Gonçalves, M. C.; Caram, R.: ISE and fracture toughness evaluation by Vickers hardness testing of an Al3Nb-Nb2Al-AlNbNi in situ composite. J. Alloys Compd. 2009, 472, pp. 65–70, doi:10.1016/j.jallcom.2008.04.016.
(18) Tabor, D.: The physical meaning of indentation and scratch hardness. In: Br. J. Appl. Phys. 1956, 7, pp. 159 – 166, doi:10.1088/0508-3443/7/5/301.