The “Digital Twin – Integrated Geomonitoring” project, which is being funded by the RAG-Stiftung (no. 20-0013), uses innovative methods and research instruments in order to gain a clear understanding of the processes that are associated with environmental changes and to present the results of the research in a transparent way. The integration of data from geological modelling based on geological, hydrogeological and mining archive maps as part of a data fusion exercise will help identify the position of tectonic faults and areas at increased risk of subsidence and settlement. With the support of satellite images, spatial-temporal and multispectral analyses can be carried out in order to show the environmental changes taking place in the region concerned. These space-time analyses used satellite data collected by the Landsat 4, 5, 7, 8, 9 and Sentinel 2 missions and allowed the target area to be visualised over a period of years from 1984 to the present day. Drone flights and in-situ measurements using mobile GIS were deployed in order to check the results. Drone flights have a higher spatial resolution than satellite images and changes taking place within a certain area become more visible as a result. A mobile GIS application on a smartphone or tablet makes it possible to screen an area in situ by collecting data in the form of terrain descriptions and images.
Amalgamating these investigations in combination with the scientific experience that has been built up by the Research Center of Post-Mining (FZN) at TH Georg Agricola University (THGA), Bochum/Germany, leads to a better appreciation of events and provides more transparency when it comes to understanding the transformation processes taking place in the environment.
1 Introduction
The Ruhr Basin, which is in the west of Germany, developed over the years into one of Europe’s foremost industrial regions. Here the mining industry has left a visible legacy in the form of countless spoil tips that have been restored to nature and assimilated into the landscape as recreational areas. Many of these sites have been provided with viewing platforms (Figure 1a) and attractive works of art (Figure 1b).
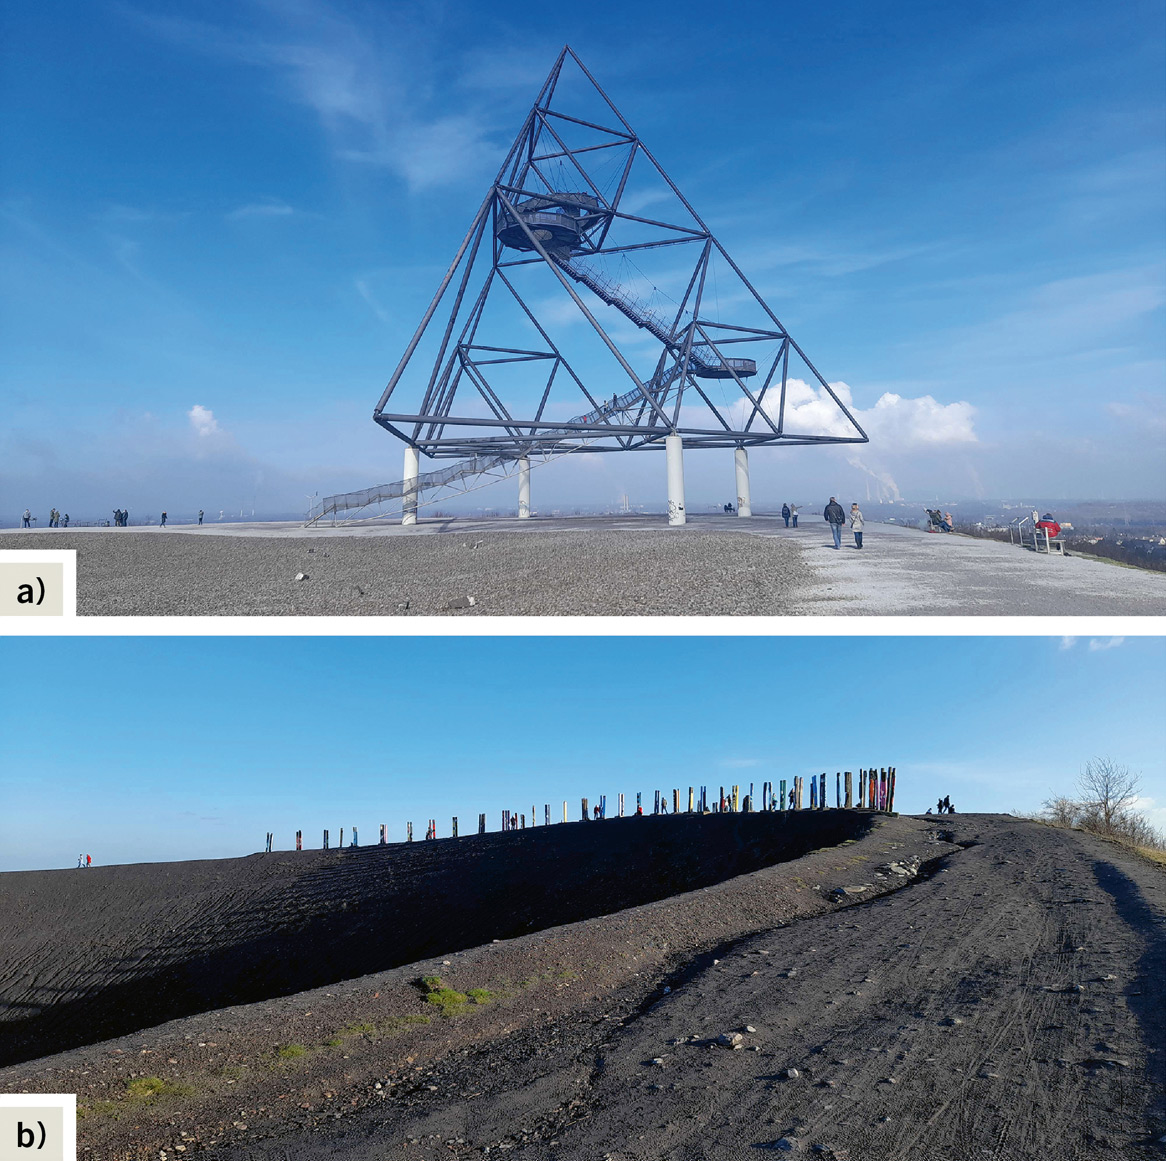
Fig. 1. Examples of spoil-tip reuse in Bottrop: a) Spoil tip on Beckstraße (with the tetrahedron viewing platform), b) Haniel spoil tip with the “totem” artwork and outdoor theatre. // Bild 1. Beispiele zur Nachnutzung der Halden in Bottrop: a) Halde Beckstraße (Aussichtpunkt Tetraeder), b) Halde Haniel mit Kunstwerk „Totem“ am Bergtheater auf der Halde. Photos/Fotos: M. Pawlik
Mining has had a huge impact on its local environment, not only when the industry was in full swing but also after the mines closed. Ground movements affect buildings (Figure 2a) and streets (Figure 2b) – but most of all they impact on the water balance. The result in some polder areas is insufficient water runoff due to the fact that the direction of flow is disrupted and in some cases even reversed. In order to solve the drainage problem a system of pumping stations was established in the Ruhr coalfield area (1). If the pumps serving the polder meadows were turned off a major part of the Ruhr Basin would be flooded (2).
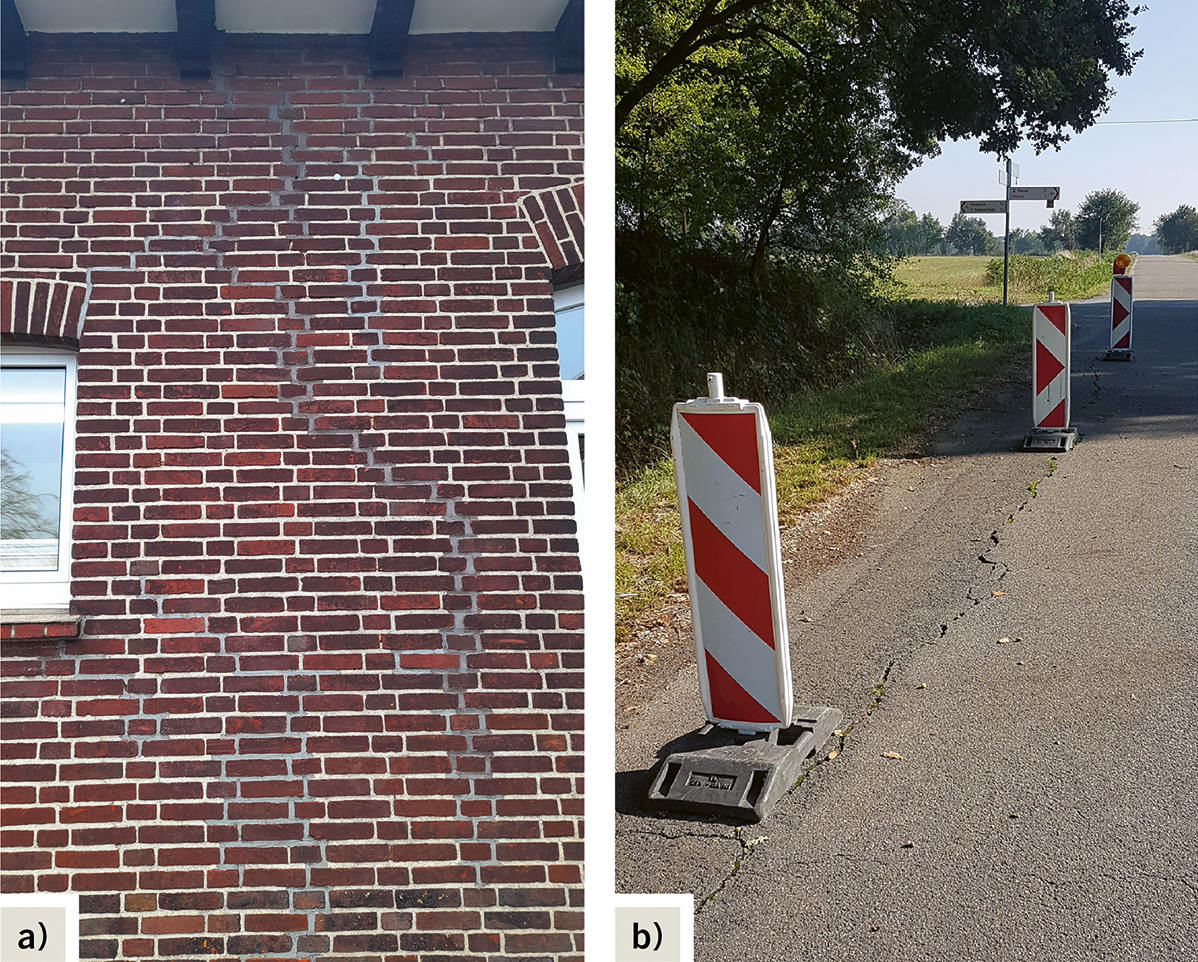
Fig. 2. Examples of mining-related damage: Gregor school in Bottrop-Kirchhellen (a), repairs to a cracked wall surface, Langer Weg (b), scarred road surface. // Bild 2. Beispiele von Bergschäden: Gregorschule in Bottrop-Kirchhellen (a), sanierter Wandzerrungsriss, Langer Weg (b), Zerrungen im Straßenbelag. Photos/Fotos: M. Pawlik (a), M.Hegemann (b)
Extensive hard coal mining over many years has meant that the entire Ruhr area has been affected by ground movement in some way or another. Between 1892 and 2010, e. g., mining subsidence accounted for sinkages of more than 20 m in the ground level in some parts of the region (3).
The last hard coal mine to close in the Ruhr coalfield was Prosper-Haniel colliery, which ceased production in 2018 (4) (Figure 3).
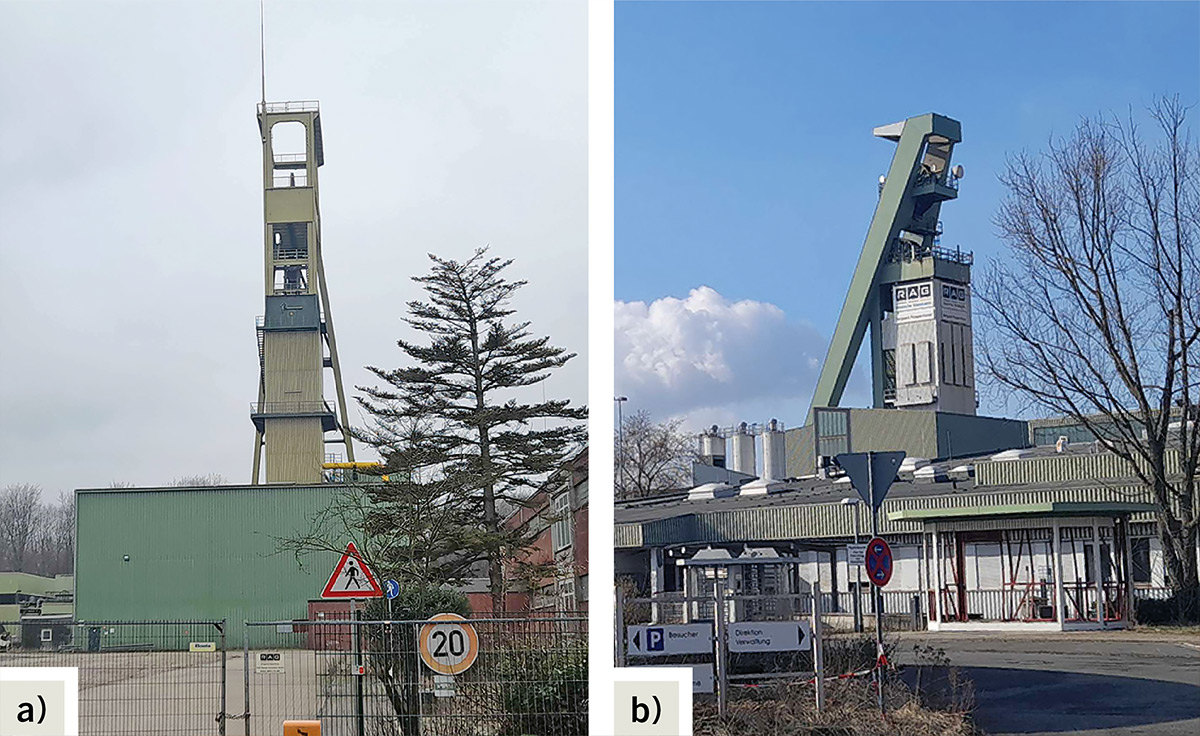
Fig. 3. Mine shafts 9 (a) and 10 (b) at Prosper-Haniel colliery. // Bild 3. Schächte 9 (a) und 10 (b) des Bergwerks Prosper-Haniel. Photos/Fotos: M. Pawlik
The working boundaries of this mine (Figure 4) form part of the study area used for the “Digital Twin – Integrated Geomonitoring” project. The concept of integrated geomonitoring, as used in this project, is one of the most innovative and up-to-date research methods available for understanding post-mining processes.
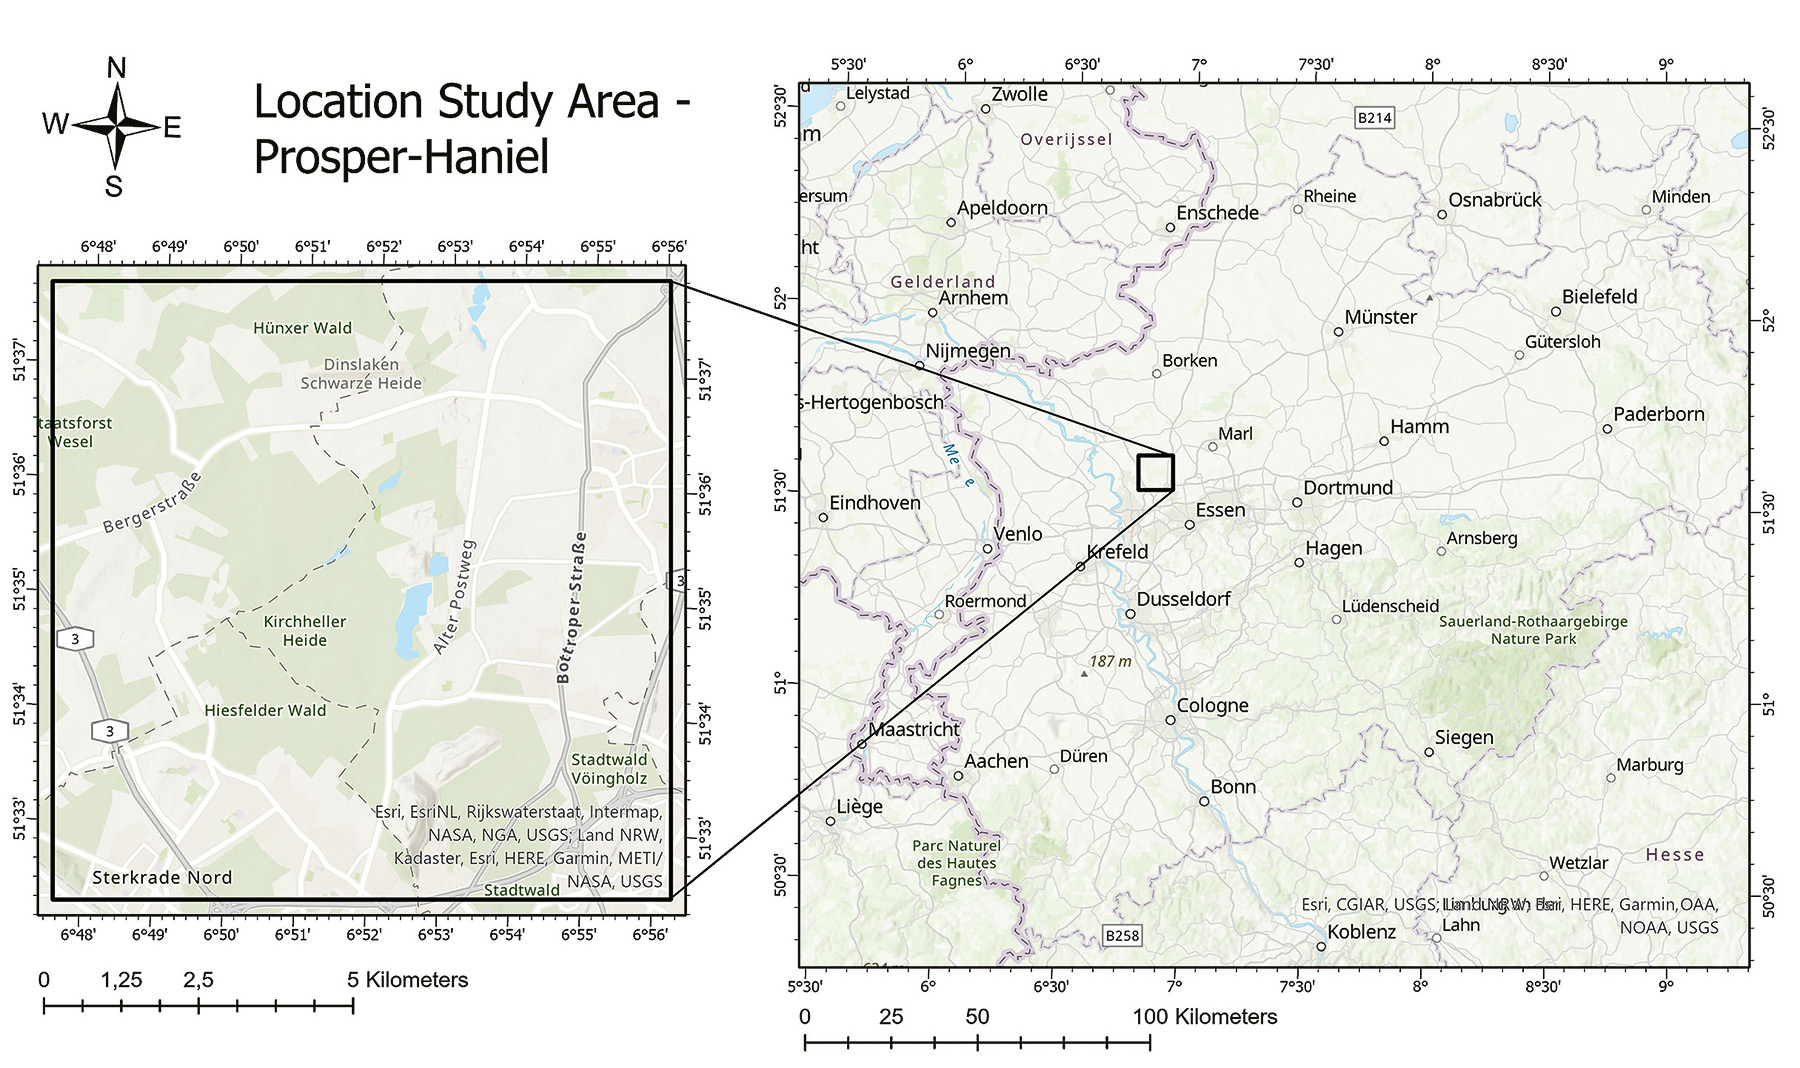
Fig. 4. Location of the project study area (5). // Bild 4. Lage des Forschungsgebiets (5).
European Union Directive 2011/92/EU requires that an assessment be carried out of all changes arising as a result of mining activities that may affect man and the environment (6).
Mining operations can have a major impact on the environmental media, namely water, soil and air (7, 8). The extraction of raw materials will in general have an effect on people, nature and the environment. The complexity of this process is characterised by many different aspects that have to be taken into account when mining processes are being interpreted. Environmental changes, which will occur both during the mining operation and after it has concluded, are continuous and long-term in nature and for this reason integrated long-term monitoring is an important issue. Kretschmann (9) points out that these tasks do not have a fixed timeframe and so can be classed as perpetual obligations.
This also includes the impact on water resources, e. g., as a result of mine dewatering operations for the regional water management bodies. The deep mining of raw materials entails activities that cause ground movements – subsidence, tilt, stretching and compression, as well as uplift due to rising mine-water levels (after the mine is closed) – and these can be associated with changes in vegetation and in a reduction in land usage. Furthermore, the gas emissions that are linked to the mining industry have a damaging effect on the natural resource of air. A targeted programme of environmental and geotechnical monitoring calls for an integrated, spatial monitoring concept based on various datasets that have to be collected, analysed and interpreted (10,11). These will contain information that has been acquired during the mining phase, e. g., mining, geological and operational plans, images obtained from multispectral and hyperspectral satellite sensors, aerial documentation provided by copter drones and aircraft and in-situ sensor data. The analysis of these diverse datasets forms the basis for a better understanding of the post-mining processes.
This paper provides an overview of the latest environmental and geotechnical monitoring methods that can track and observe mining-relevant objects from space and from the air, as well as at and below ground level. Given the application of multi-sensor observations with different spatial-temporal resolutions it also discusses how these data can be integrated into a comprehensive system.
2 Methodology
All available data were used in order to gain a full understanding of the phenomenon of post-utilisation. Part of the project involved the preparation of a three-dimensional model of the geo-architecture (see 2.1), this being followed by spatio-temporal analyses based on satellite images from space missions undertaken during the period 1984 to 2022 (see 2.2). Finally, an in-situ review was carried out of the data obtained from the drone flights (see 2.3.1) and of the data collected by mobile GIS (see 2.3.2).
The concept of multidimensional data integration, which is also referred-to as “sensor data fusion“, is explained in articles written by Pawlik et al. (5, 12) and Rudolph et al. (13) and is presented in Figure 5.

Fig. 5. Methods used for geotechnical and environmental monitoring (13). // Bild 5. Methoden des Geo- und Umwelt-Monitoring (13).
2.1 Geological modelling
The aim of this work is to develop and analyse geoscientific 3D subsurface models of the former Prosper-Haniel mine workings. These models are designed to represent the overburden both prior to coal extraction and also during the post-mining period. Linking up with remote sensing data creates a potential opportunity for identifying the underground processes and structures involved and this can provide a better understanding of the post-mining changes taking place in this region.
The model is able to produce high-resolution images of the subsurface structures and regional-geological situation as based on currently available information. The transition from the Oligocene into the Upper Cretaceous is modelled in two dimensions, beginning with the base of the Quaternary. The model is then further developed to include the formation boundaries in the Cretaceous, Triassic and Permian until it is able to map out the interface with the Carboniferous.
Historical mining documents are a valuable source of data for modelling the deeper levels of the Ruhr area. Existing layout plans, structural maps and isoline maps (Carboniferous surface, Bunter sandstone) were geo-referenced, digitised and interpreted and then combined and compared with current data.
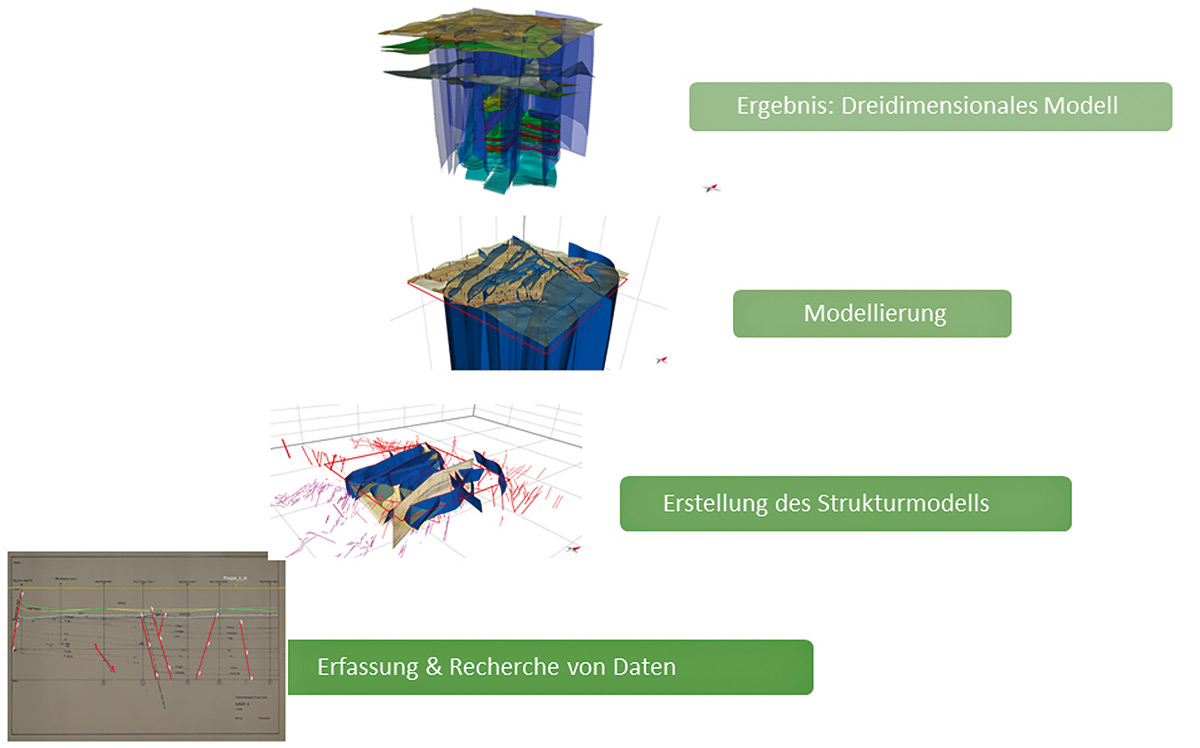
Fig. 6. Research methodology for 3D modelling of the geological structures. // Bild 6. Forschungsmethodik für die 3-D-Modellierung der geologischen Strukturen. Source/Quelle: FZN
In this way it was possible to produce an integrated model of the overburden within the study area (Figure 6):
Data acquisition and research
- Research of map and archive material with geo-referencing where necessary:
- 40 mine-survey profiles of working districts and lateral roadways (Prosper, Franz Haniel, Jacobi, Lohberg);
- 19 hydrogeological profiles (HK10, HK25);
- 35 deep-tectonic profiles (Dorsten major anticline, Emscher major trough);
- 14 engineering-geological profiles (4406 Dinslaken, 4407 Bottrop);
- 61 2D-seismic profiles (Lohberg 1952, Kirchhellen 1953, Bottrop 1957, Nordlicht 1958, Prosper-Haniel 1975, Schermbeck 1981).
- Logging of cutting positions and roadways from the digital seam archive for NRW.
- Spatial position and depth transformation of profile cuts and digitisation of fault positions and layer boundaries.
Creation of the structural model
- Interpretation and modelling of the fault pathways in order to develop underground structures from different presentation levels (horizons).
Drilling data selection
- Processing of database enquiries and evaluation of drillings in the DABO NRW (GD NRW) drill database.
- Qualitative assessment of drilling classifications.
Modelling
- Modelling of reference and formation boundaries.
Additional activities
- Two-dimensional calculation of actual mine subsidence events at certain points in time (2005, 2010, 2015 and 2020) as based on LiDAR data;
- LiDAR analysis aimed at registering mining discontinuities
- small-scale subsidence analyses for referencing spatial-temporal interactions;
- three-dimensional implementation of the height sequences of the reference levelling in the second-order datum point field;
- reconstruction of overall heights and mine workings (winding shaft, lateral roadways) based on a reconstruction of the deposits;
- derivation of various map themes (working thickness, extraction-subsidence ratio, northward migration).
2.2 Remote sensing
Data acquisition is an important project stage, as the results that are ultimately required depend on it (14). Remote-sensing data sources for the Digital Twin project included satellite images obtained by the Landsat (NASA) and Copernicus (ESA) missions. Before the data gathering process began it was therefore necessary to define criteria on the basis of which it would be possible to assess these data in terms of their suitability for the project (12).
Pawlik et al. (12) propose the following criteria:
- Time span: the time series covers the period from 09/1972 (the Landsat 1 mission) to 2023 (the Landsat 7 to 9 and Sentinel 2 missions).
- Time resolution: “The time resolution indicates how often or at which time intervals a sensor is able to record a certain area” (15).
- Spatial cover: The spatial cover is defined by the study area.
- Spatial or geometrical resolution: The spatial or geometrical resolution is a measure of the smallest object that can be distinguished by a sensor. It can be compared to a pixel in a remotely sensed image (15). “The greater the spatial resolution, the more accurate will be the resulting data” (12). Here the spatial resolution will depend on the satellite mission in question.
- Spectral resolution: “The spectral resolution indicates how many spectral bands a sensor can record in at the same time” (16).
A knowledge of the individual spectral bands of the satellites enables a calculation to be made of the vegetation indices. The latter play a very important role for the geo-monitoring of post-mining issues (12).
The latest satellite systems are ideal for vegetation observations in that they feature excellent adaptation to the spectral ranges both with regard to spatial resolution and to spectral-range frequency (12,17).
- Cloud cover: Only those satellite images taken under conditions of minimal cloud cover were used for the survey. In central Europe this generally tends to reduce the availability of optical satellite data.
Data gathering begins by cropping the results to fit a specified study area. The evaluation method then has to be selected and adapted to suit the problem at hand. The usual practice is to employ indicators so that additional information can be obtained about a certain aspect by apportioning the data from different spectral channels. When considering vegetation health, e. g., chlorophyll is one of the subject elements that has a vital role to play. Chlorophyll absorbs energy in certain wavelengths and uses photosynthesis to generate carbon for plant growth. However, certain energy-rich wavelengths are reflected in order to protect the plant from overheating (18).
The Digital Twin project analysed three groups of indicators, namely those based on vegetation, soil and water. Pawlik et al. (12) have singled out vegetation indices, which can be useful for observing vegetation development when engaged in the geomonitoring of mining follow-up processes.
As post-mining processes are of a long-term nature it is extremely important to have a sustained (continuous) geomonitoring regime in place. In this particular study area mining operations lasted from the 1970s to the year 2018 (4, 19), which means that the changes taking place at ground surface can be registered by way of space-time analyses.
The Normalised Difference Vegetation Index (NDVI) is a vegetation indicator developed by Rouse et al. (20). The NDVI is based on the bands in the red and near-infrared range of the spectrum. The time-series analysis presented in figure 7 illustrates how the landscape of the study area has changed over the years.
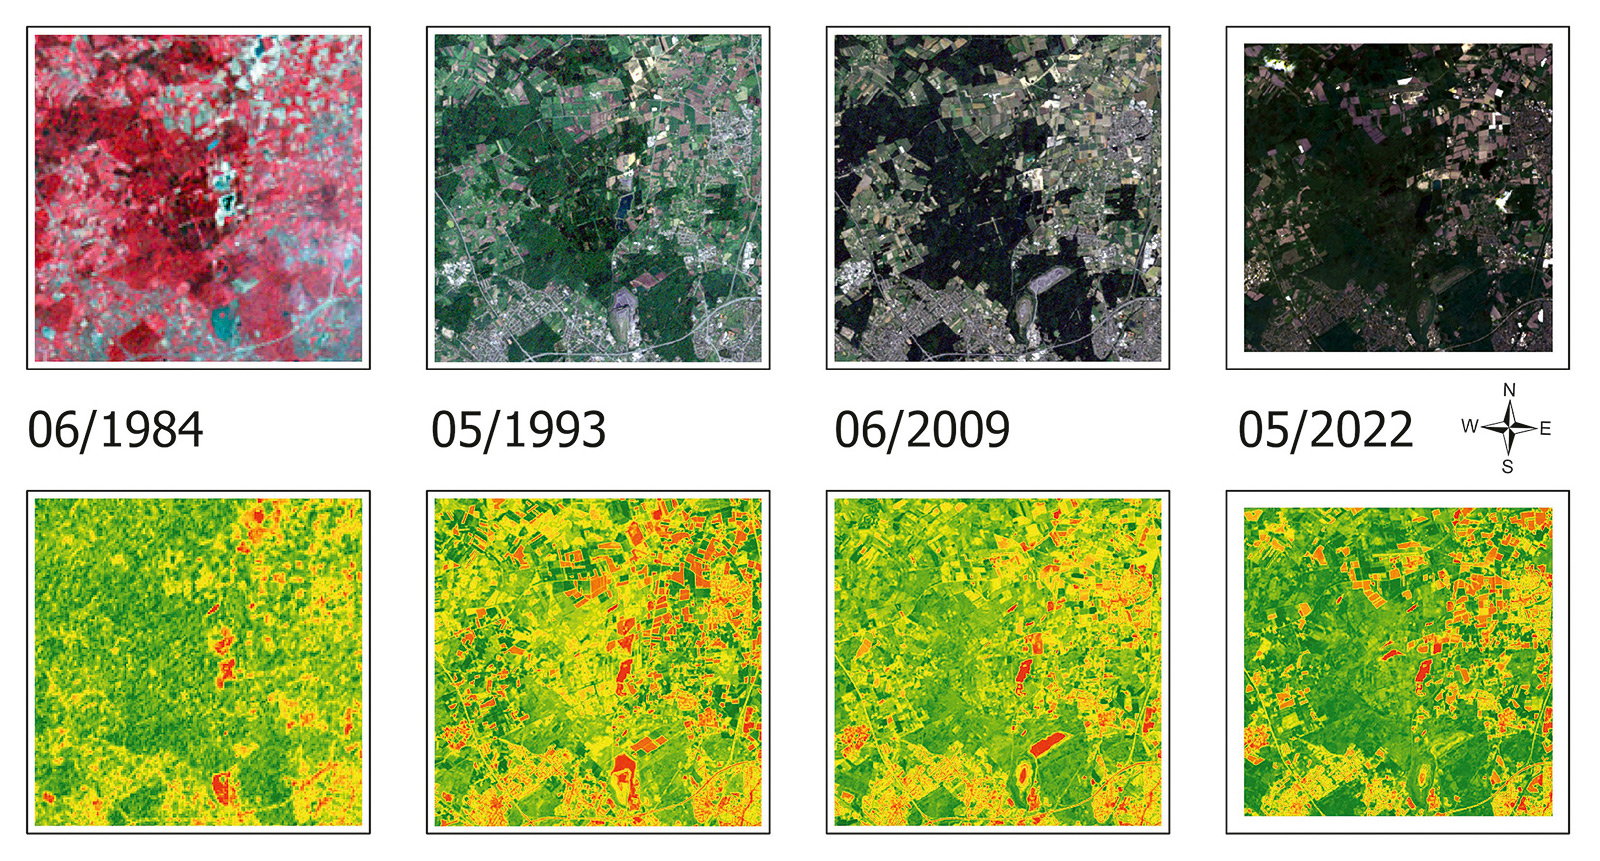
Fig. 7. Spatio-temporal, multispectral analysis – NDVI. // Bild 7. Räumlich-zeitliche, multispektrale Analyse – NDVI. Source/Quelle: FZN
The top row shows the false-colour images while the bottom row contains the results based on the NDVI. The index presents the values in the range of −1 to 1. According to the classification by Kuechly et al. (18) red colours denote plots of land, streets, buildings and water, while green colours represent the vegetation, the lighter tones indicating a lower plant vitality and the darker tones a very high vitality level.
The changes observed in the study area (Figure 8) could essentially be traced back to:
- colliery spoil tips: the Haniel, Schöttelheide and Töttelberg tips;
- mining subsidence lakes: Weihnachtssee, Pfingstsee and two unnamed subsidence lakes;
- near-surface sand and gravel extraction at the Stremmer and Spickermann sandpits.
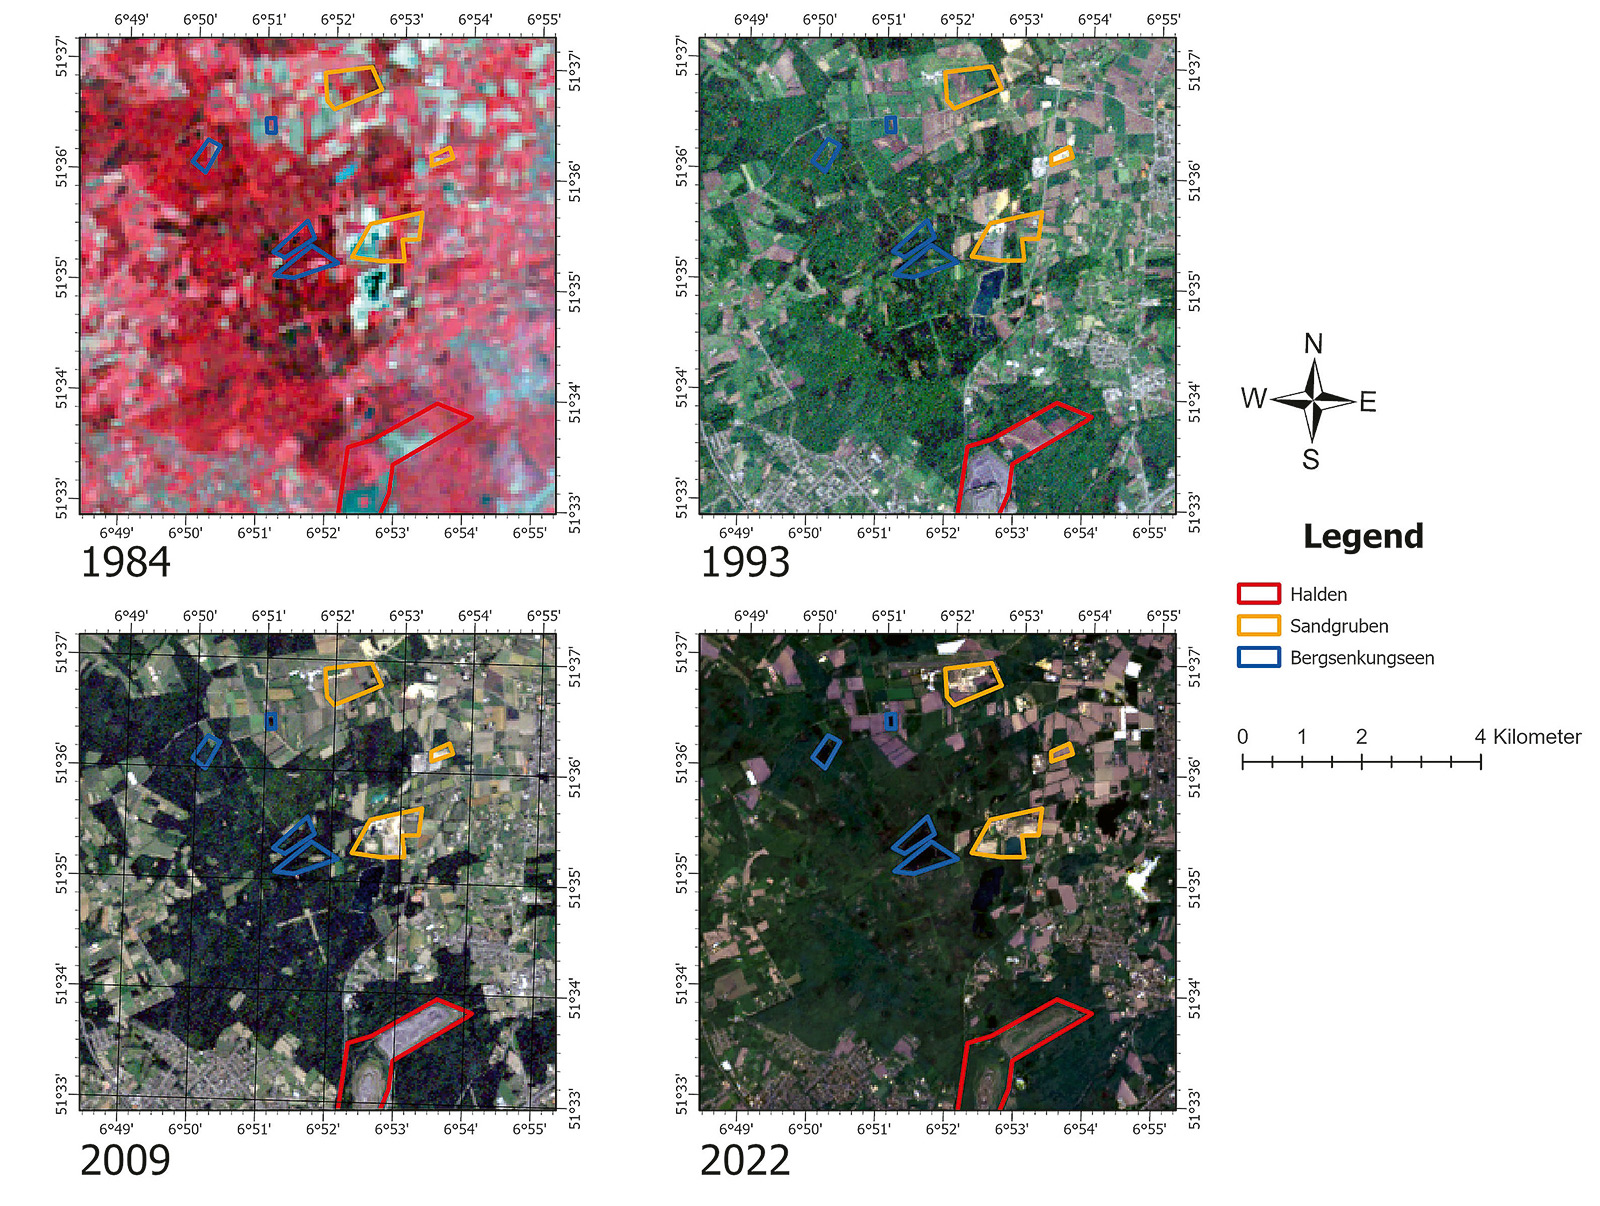
Fig. 8. Changes to the study area between 1984 and 2022. // Bild 8. Veränderungen im Forschungsgebiet von 1984 bis 2022. Source/Quelle: FZN
2.3 In-situ measurements
Remote sensing data can provide information on large areas while in-situ measurements and observations are more suited to supplying individual measurement results.
In-situ measurements are an important aspect of the results validation process (21, 22). As well as providing various other remote sensing indicators, analyses based on satellite images supply information about the status of the vegetation. However, in the case of wooded areas these observations are restricted to the upper layers of vegetation, in other words the treetops. The lower layers are not visible and must be surveyed on the ground in order to complete the database. These results are presented in detail in Bernsdorf et al. (21, 22).
In this case the project measurements were taken by drones fitted with a range of cameras, including RGB equipment and multispectral sensors. Mobile GIS was used to record terrain data and in this way to generate “ground truth” information.
2.3.1 The use of drones
Unmanned aerial systems (UAS), commonly referred-to as drones, can carry special sensors that are comparable with those fitted to satellites. However, because of their much higher spatial resolution drones are better able to produce detailed data. The drone used in this particular project was equipped with special sensors whose channels were equivalent to, and could emulate, those of the Landsat and Sentinel 2 satellites in terms of index deduction.
Drones fitted with multispectral cameras – prevalently red, green, blue, red edge and near infrared – are therefore suitable for gathering data that enable precise calculations to be made of the vegetation indices. The excellent ground resolution of a few centimetres makes for an almost razor-sharp identification and it is even possible to distinguish between individual plants. The copter drone used for the project had a ground resolution of altitude/18.6 (a flight altitude of 100 m produces a ground resolution of 5.3 cm x 5.3 cm per pixel).
Copter flights of this kind can therefore be used for the highly precise recording of the phenomena that occur in a certain area. They can, for example, help us to understand how changes in soil moisture levels can affect the vegetation indices before the less well defined satellite data available for large areas can be processed. This process understanding can be visualised both in 2D and in 3D space.
The paper published by Pawlik et al. (23) includes a résumé of the spectral channel characteristics for the DJI Phantom 4 and Sentinel 2 satellite missions. This shows that the bands recorded by the drone correspond to the spectral bands of the satellite missions or lie within the area of the sensor band width.
When planning to carry out drone flights it is necessary – in certain areas at least – to obtain the permission of the local landowner or site management company. Moreover, the drone operator must comply with national and EU regulations that lay down clear guidelines on the following: flight altitudes, distance to be maintained between the drone and nearby streets and buildings and the need for extreme care when flying close to groups of people. The ability to perform a drone flight will also depend on the prevailing weather conditions (24). As an institution that regularly uses drones for research purposes the Research Center of Post-Mining (FZN) at TH Georg Agricola University (THGA), Bochum/Germany, works closely with the licensing authorities on obtaining exemptions from certain statutory offences and has been issued with the necessary approvals. This arrangement greatly simplifies those spur-of-the-moment missions that have to be undertaken, for example, when a flight has been delayed due to adverse weather conditions.
The investigations conducted by the FZN involved a series of drone flights whose purpose was to produce conventional and multispectral orthophoto maps that were more precise than satellite images. This included using drones to capture images that took account of the relevant configurations in respect of flight altitude, lateral overlap and longitudinal overlap. To achieve this the team used a DJI drone fitted with a Phantom 4 multispectral camera with real-time kinematic positioning (RTK). Thanks to this module it is possible to receive signals from the global navigation satellite systems (GPS, GLONASS, BeiDou, Galileo) and correction data from the satellite positioning services (SAPOS) operated by the German Ordnance Survey Office. This delivers a spatial positioning accuracy of 2 to 3 cm.
As already mentioned, satellite data have a lower spatial resolution than drone-supplied data. The images provided by the Sentinel 2 space mission were received in a spatial resolution of 10 m x 10 m per pixel (Figure 9).
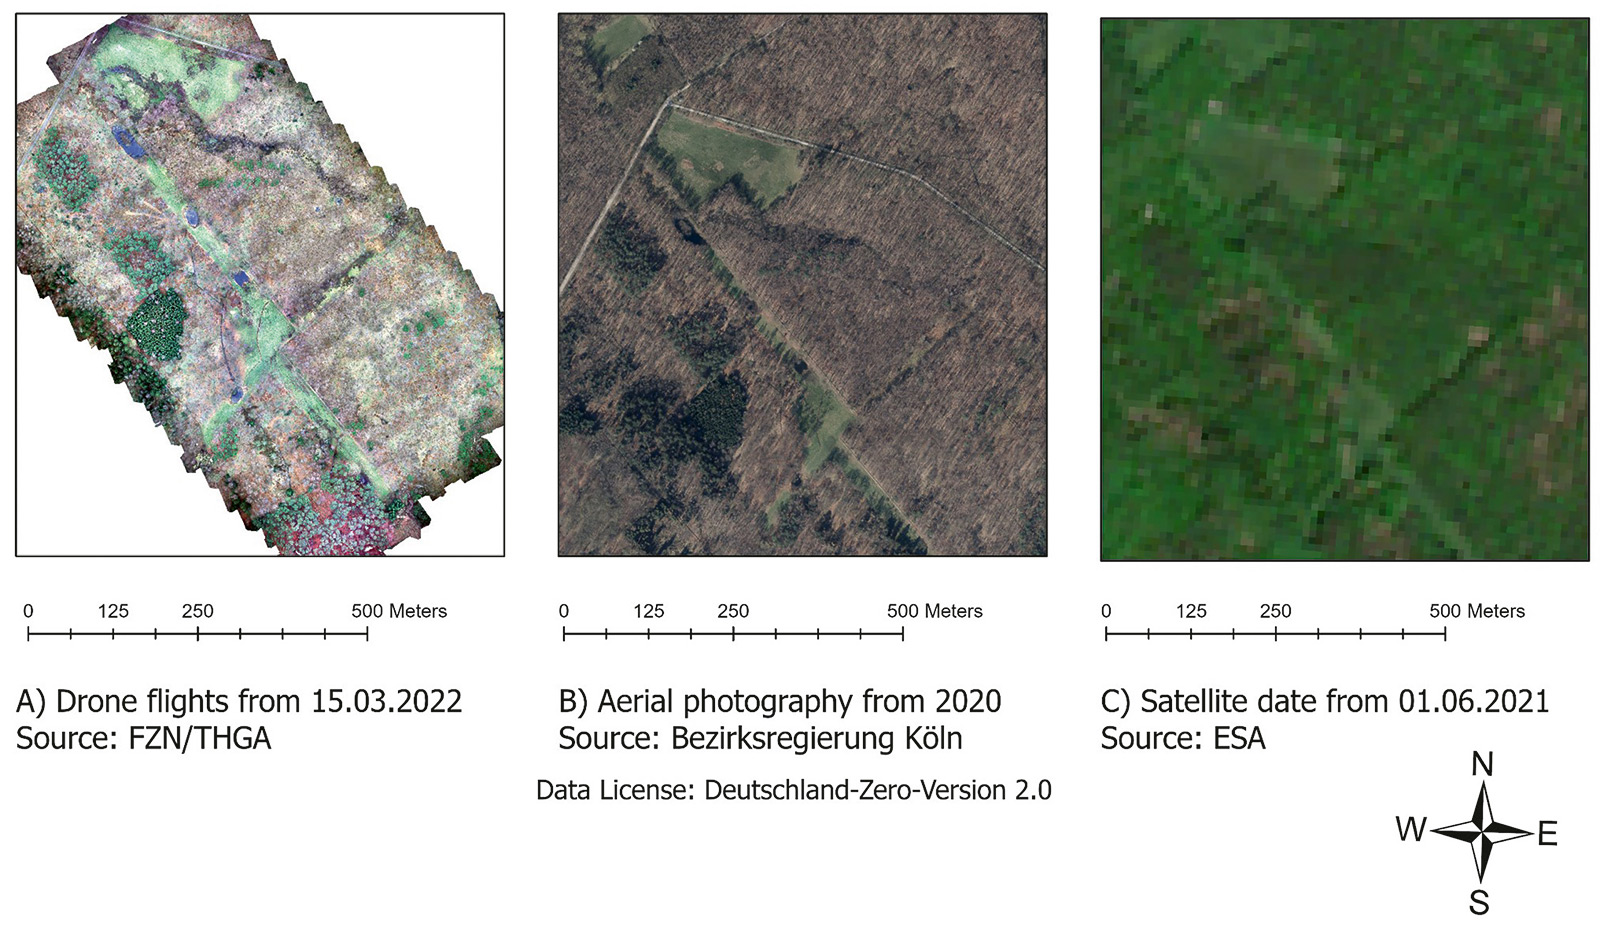
Fig. 9. Spatial resolution a) drone flight (5 cm), b) aerial photo (10 cm) and c) Sentinel 2 (10 m) (25). // Bild 9. Räumliche Auflösung a) Drohnenflug (5 cm), b) Luftbild (10 cm) und c) Sentinel 2 (10 m) (25).
The examples given in Figure 9 show how drone flights can be used to survey small bodies of water that would not be recognisable on aerial and satellite images.
2.3.2 Mobile GIS
According to Tsou (26) mobile GIS is “an integrated software and hardware framework for access to geodata and geo-services using mobile devices operating via wired or wireless networks”.
The integration of mobile GIS with sensors to measure soil humidity and temperature is described in Bernsdorf et al. (21, 22), Flügge (27) and Pawlik et al. (28). As the soil sensors deployed for areal mapping cannot display data a mobile GIS is used to collect and present the results. This supplements the logger stations and the weather stations with their soil sensors that are connected via wide area networks (WAN). The aim of including a mobile GIS was to compress the measurements from the logger stations on sample areas.
Mobile GIS was also used to verify the results of the subsurface modelling as well as those obtained from the multispectral analyses based on the satellite images. The tectonic outcrop limits of the geological modelling also served as orientation points for the documentation of the in-situ measurements by mobile GIS (Figures 10, 11).
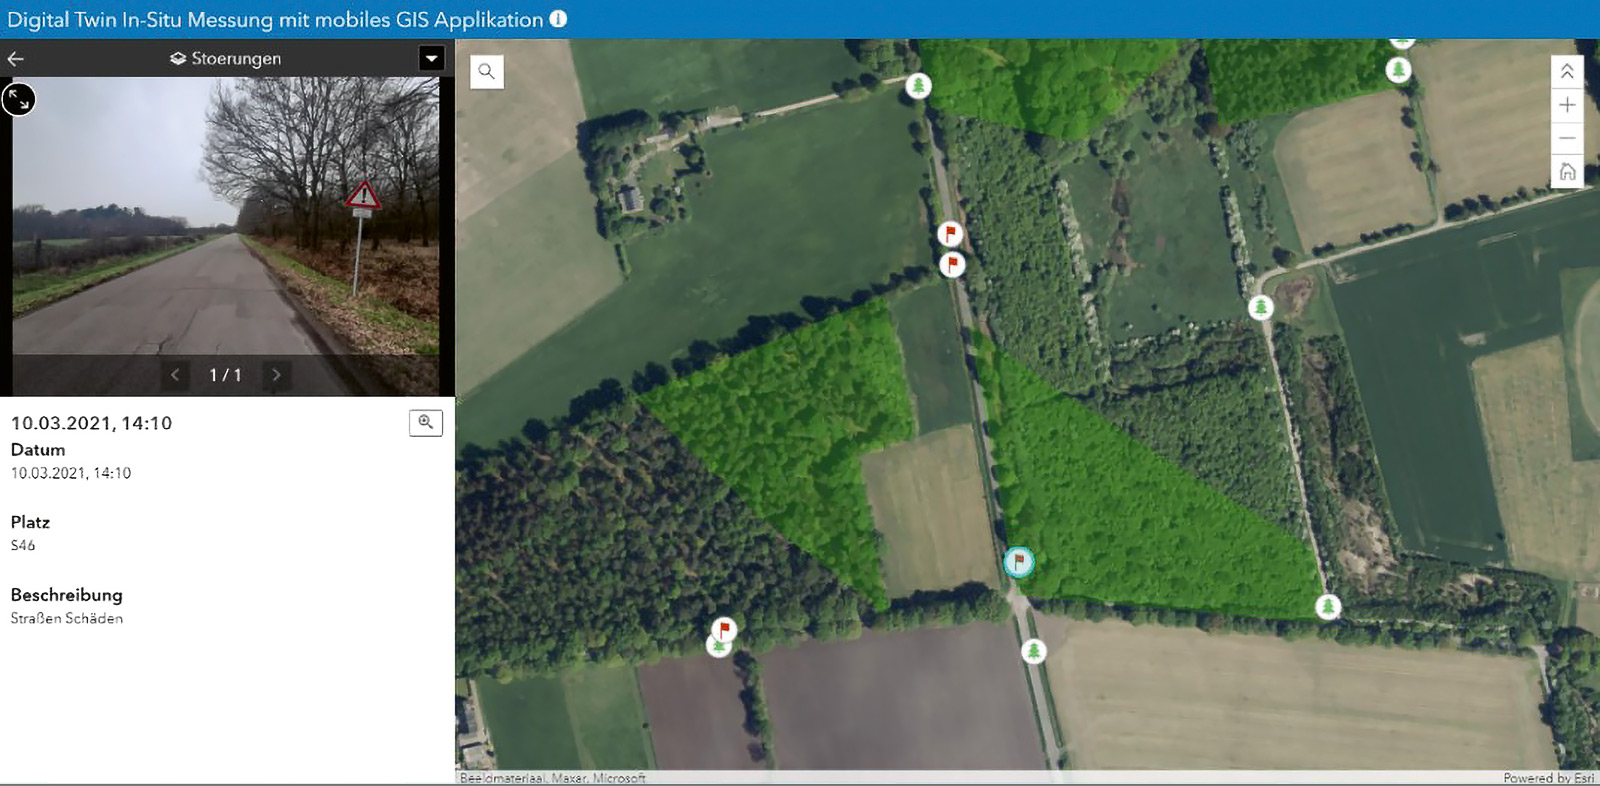
Fig. 10. In-situ measurement using ArcGIS Collector. The green area represents a disturbance zone. // Bild 10. In-situ Messung mit ArcGIS Collector. Die grüne Fläche stellt einen Störungs-bereich dar. Source/Quelle: FZN
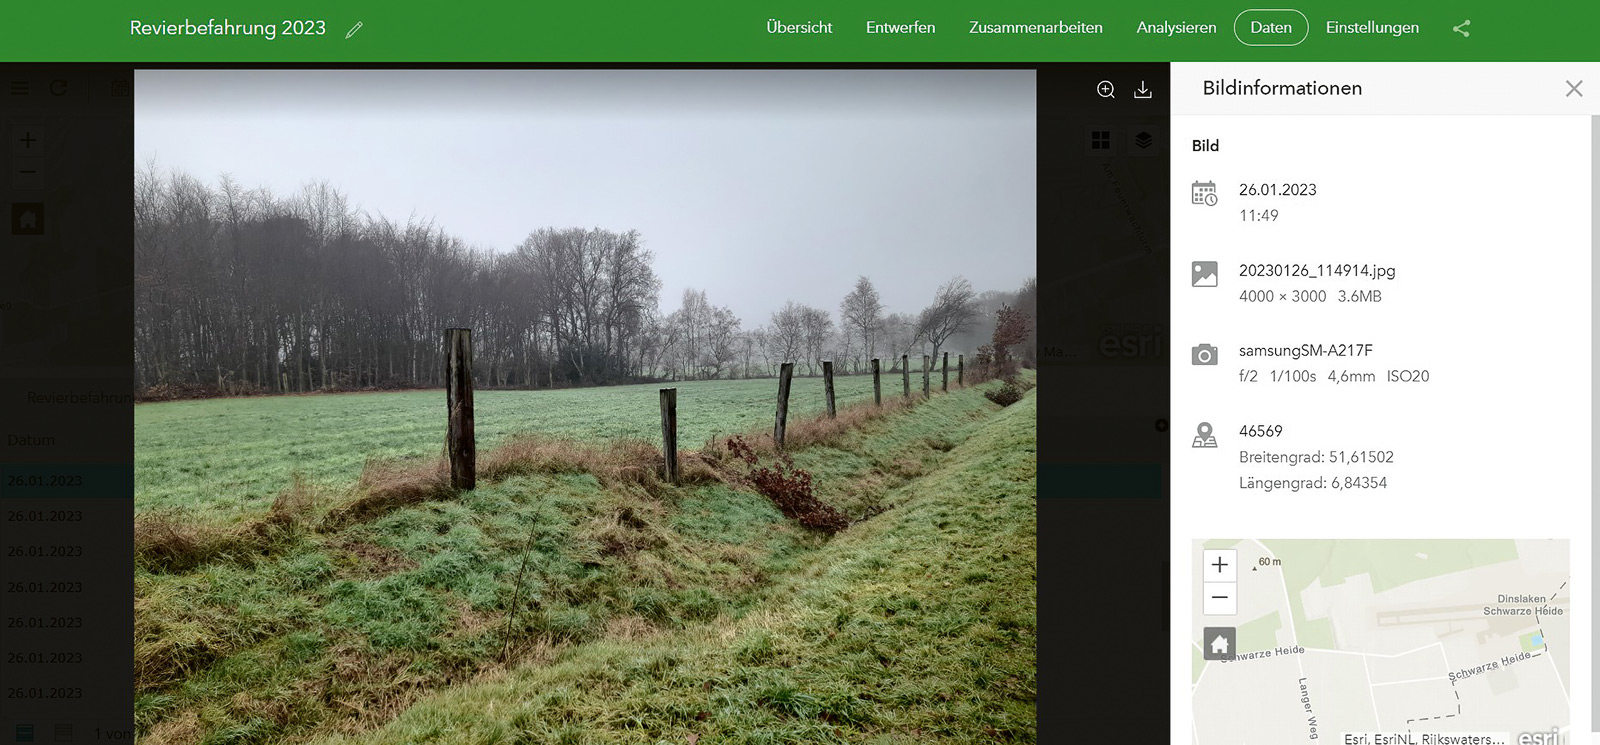
Fig. 11. Discontinuity in the study area. // Bild 11. Unstetigkeit im Untersuchungsgebiet. Source/Quelle: FZN
Spatio-temporal analyses based on calculated remote-sensing indices enable observations to be made of changes in the environment. In Pawlik et al. (29) the formation of the subsidence lake is described using calculated indices: the NDVI (Normalised Difference Vegetation Index), GNDVI (Green Normalised Difference Vegetation Index), NDWI (Normalised Difference Water Index) and MNDWI (Modified Normalised Difference Water Index) were calculated for the period 1984 to 2021. The study showed that between 2002 and 2012 the NDVI and GNDVI decreased whereas the NDWI and MNDWI increased, this being substantiated by the formation of water bodies in the area. The results were checked by mobile GIS. An example of these findings is shown in Figure 12.
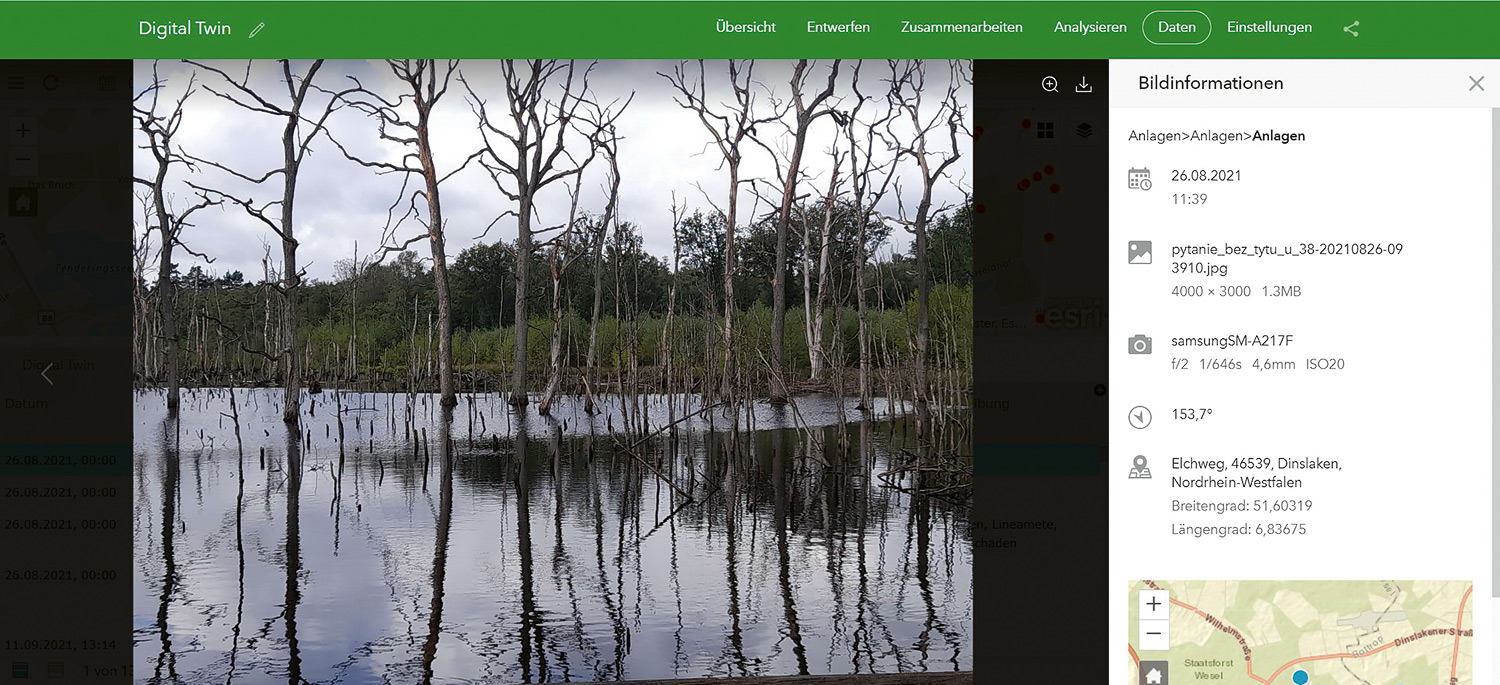
Fig. 12. Mining subsidence lake (25). // Bild 12. Bergsenkungssee (25).
3 Data integration
Post-mining processes constitute an open and complex system that can only be properly understood by consulting all available data. Using methods based on satellite images, drones and in-situ measurements provides results with different spatial and temporal resolutions. Modelling the geological structure in combination with information on past mining activities makes it possible to visualise changes to the Earth’s surface. This is needed in order better to understand the processes taking place above ground.
In order to be able to identify global trends and changes it was decided to employ satellite remote sensing so that large areas could be observed with a spatial resolution of 10 to 30 m. Local changes were studied by means of drone missions as these enabled observations to be made with a spatial resolution of just a few centimetres. Here it was found that flights undertaken under cloudy skies yielded better quality results than those carried out on sunny days. As the sensors fitted to drones exhibit similar spectral characteristics to those deployed on satellites they can be used for calculating remote sensing indices. One of the indisputable advantages of using drones is their mobility and flexibility, particularly in situations where the reception of data from satellites is not possible due, e. g., to cloud cover or to the repetitive nature of the satellite cycle.
Using data from different time periods enables environmental monitoring to be undertaken on a long-term basis. Satellite images are captured within a few days, depending on the satellite mission in question, whereas drone flights can be undertaken on the spur of the moment. Validations and additions provided by way of in-situ measurement systems enable confirmation of derived indicators for the monitoring of high-quality objects and object-based information. The positioning accuracy of the various data and the comparability of data exhibiting different degrees of resolution and quality are two of the main challenges to be addressed. It may be necessary to develop local solutions in order to ensure that data that are scaled differently can be properly merged together.
The environmental monitoring and geomonitoring of post-mining processes is a very complex undertaking as it involves all kinds of different factors that are linked together. Understanding and interpreting what is going on is only possible when the post-mining processes are considered as an entire system of interdependent factors (Figure 13). It is therefore extremely important to have raw data and specialist knowledge available in order to be able to interpret the phenomena both below and on the Earth’s surface.
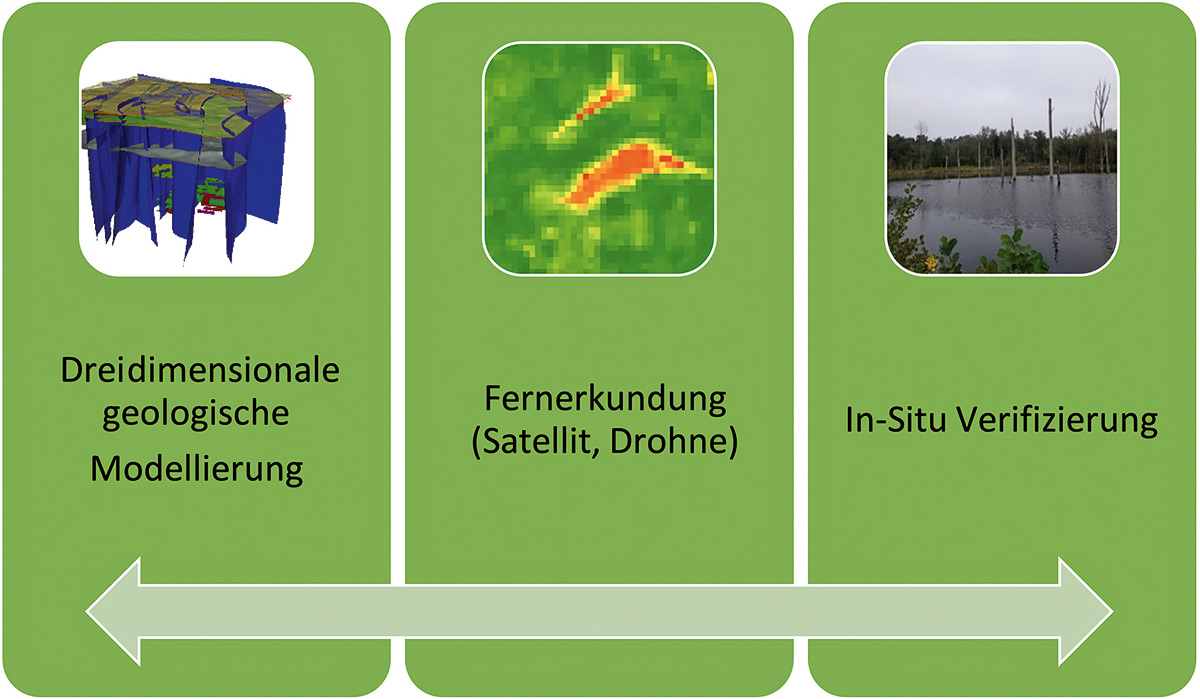
Fig. 13. Data integration in the Digital Twin project. // Bild 13. Datenintegration im Projekt Digital Twin. Source/Quelle: FZN
4 Summary
To summarise, it can be said that the “Digital twin – integrated geomonitoring” project as presented above is an example of an innovative and interdisciplinary approach to data integration and fusion aimed at interpreting and understanding post-mining processes. While the final results have not yet been made available, it can be seen that the bodies of data acquired from the various sources, containing as they do different levels of temporal, spatial and spectral resolution, will present a challenge for the amalgamation process. When interpreting changes to the environment and the impact these have on the Earth’s surface and its buildings and infrastructure it is particularly useful to be able to consult mine plans and mine survey expertise.
The authors have sought to adopt an integrated approach to the challenges outlined above and to reach a comprehensive understanding of the processes involved. This creates the basis that is needed to ensure transparency and solid community engagement.
References / Quellenverzeichnis
References / Quellenverzeichnis
(1) Emschergenossenschaft und Lippeverband: www.eglv.de (Online: 31.01.2023)
(2) Peters, R. (1999): 100 Jahre Wasserwirtschaft im Revier: die Emschergenossenschaft 1899 − 1999. Verlag Peter Pomp, Bottrop, Essen, 267 S.
(3) Harnischmacher, S.; Zepp, H. (2013): Bergbaubedingte Höhenänderungen im Ruhrgebiet. Tagungsband: Nachbergbau in NRW.
(4) Böse, C.; Farrenkopf, M.; Weindl, A. (2018): Kohle-Koks-Öl. Die Geschichte des Bergwerks Prosper-Haniel. Aschendorff Verlag, Münster.
(5) Pawlik, M.; Gellendin, M.; Bernsdorf, B., Rudolph, T., Benndorf, J. (2022): Digital-Twin – How to Observe Changes and Trends on the Post-Mining Areas? In: International Journal of Earth and Environmental Science 2022, 7: 195
https://doi.org/10.15344/2456-351X/2022/195
(6) Richtlinie 2011/92/EU des Europäischen Parlaments und des Rates vom 13. Dezember 2011 über die Umweltverträglichkeitsprüfung bei bestimmten öffentlichen und privaten Projekten (Kodifizierung).
(7) Goerke-Mallet, P.; Melchers, C.; Müterthies, A. (2016): Innovative monitoring measures in the phase of post-mining. IMWA 2016, Freiberg/Germany, pp 570 − 577.
(8) Melchers, C.; Goerke-Mallet, P.; Kleineberg, K. (2016): Elements and Aspects of the Post-Mining Era. In: Mining Report Glückauf (152), issue 3, pp 215 − 223.
(9) Kretschmann, J. (2015): The sustainable development strategy of the German hard coal mining industry. Proceedings of 7th Sustainable Development in the Minerals Industry Conference (SDIMI), University of British Columbia, Vancouver, Canada, pp 1 − 9.
(10) Rudolph, T. (2020): Digital Twin – Integriertes Geomonitoring weiterentwickelt. In: Technische Hochschule Georg Agricola, Forschungszentrum Nachbergbau & Deutscher Markscheider Verein (eds.): Tagungsband Bergbau, Energie und Rohstoffe 2019. Übergang zu neuen Zeiten, 11. − 13. September 2019, Technische Hochschule Georg Agricola, Bochum, S. 15 − 22.
(11) Rudolph, T.; Goerke-Mallet, P.; Melchers, C. (2020): Geomonitoring im Alt- und Nachbergbau. In: ZfV 145 (3), S. 168 − 173. Online verfügbar unter: https://doi.org/10.12902/zfv-0294-2020
(12) Pawlik, M.; Rudolph, T.; Benndorf, J.; Blachowski, J. (2021): Review of vegetation indices for studies of post-mining processes. IOP Conf. Ser.: Earth Environ. Sci. 942 012034, 2021, https://doi.org/10.1088/1755-1315/942/1/012034
(13) Rudolph, T.; Yin, X.; Goerke-Mallet, P. (2022): Advanced definition of the geo- and environmental monitoring from the post-mining experience in the Ruhr region. In: Zeitschrift der Deutschen Gesellschaft für Geowissenschaften. https://doi.org/10.1127/zdgg/2022/0335
(14) Pawlik, M. (2019): Analysis of changes in the development of a selected area of the city of Wrocław from the 1930s to present times. Unpublished master’s thesis, Wrocław University of Science and Technology (in Polish).
(15) Maj, K.; Pabisiak,P.; Stępień, G.; Wysota, R. (2007): Detekcja a identyfikacja. In: Geodeta, 9, S. 26 − 31 (in Polish).
(16) Wiggenhagen, M.; Steensen, T. (2021): Taschenbuch zur Photogrammetrie und Fernerkundung. 6. neu bearbeitete und erweiterte Auflage, Wichmann.
(17) Buczyńska, A.; Blachowski, J. (2021): Analysis of the vegetation condition on the area of the closed Babina mine in 1989 − 2019 using multispectral satellite images. IOP Conference Series Earth and Environmental Science. 684. https://doi.org/10.1088/1755-1315/684/1/012030
(18) Kuechly, H. U.; Cozacu, A.; Kodl, G.; Nicolai, C.; Vallentin, C. (2020): Grundlagen der Fernerkundung. Inforeihe SAPIENS: Satellitendaten für Planung, Industrie, Energiewirtschaft und Naturschutz, Deutsches GeoForschungsZentrum GFZ, Potsdam, 2020.
(19) RAG Bürgerinformationsdienst: https://geodaten.rag.de/mapapps/resources/apps/bid/index.html?lang=de (Online: 31.01.2023).
(20) Rouse, J. W.; Haas R. H.; Schell J. A.; Deering D. W. (1973): Monitoring the vernal advancement and retrogradation (green wave effect) of natural vegetation. Prog. Rep. RSC 1978-1, Remote Sensing Center, Texas A&M Univ., College Station, nr. E73-106393.93.
(21) Bernsdorf, B.; Khaing, Z. P. (2023): On the evaluation of in situ sensors in the assessment of process flows in geomonitoring. In: Zeitschrift der Deutschen Gesellschaft für Geowissenschaften, https://doi.org/10.1127/zdgg/2023/0339
(22) Bernsdorf, B.; Rudolph, T.; Pawlik, M.; Bökelmann, S. (2023): Der Einsatz von Mobile GIS und RFID-Sensorik zur Bewertung multispektraler Drohnen-Daten im nachbergbaulichen Geomonitoring. GIS-Science (In der Vorbereitung).
(23) Pawlik, M.; Haske, B.; Bernsdorf, B.; Rudolph, T.; Benndorf, J. (2022): Analyse des Zustands der Vegetation auf dem Gelände des stillgelegten Bergwerks Prosper-Haniel anhand von multispektralen Satellitenbildern der Sentinel 2-Mission und Drohnenflüge. In: Markscheidewesen 129 (Nr.1), S. 37 − 44.
(24) Durchführungsverordnung (EU) 2019/947 der Kommission vom 24. Mai 2019 über die Vorschriften und Verfahren für den Betrieb unbemannter Luftfahrzeuge.
(25) Pawlik, M.; Haske, B.; Bernsdorf, B.; Rudolph, T.; Andre, J.; Blachowski, J.; Kujawa, P.; Dynowski, A. (2023): The use of mobile GIS in the scientific research-Case Studies. IOP Conf. Ser.: Earth Environ. Sci. (In Press).
(26) Tsou, M. H. (2004): Integrated Mobile GIS and Wireless Internet Map Servers for Environmental Monitoring and Management, (the Special Issue on Mobile Mapping and Geographic Information Systems). In: Cartography and Geographic Information Science. 31(3), pp 153 − 165.
(27) Flügge, P. (2022): Vergleich von Bodenfeuchtesensoren mit herkömmlichen Bodenfeuchtebestimmungen an Proben aus dem Einzugsgebiet der Boye. Bachelorarbeit im Studiengang Geotechnik und Angewandte Geologie, Technische Hochschule Georg Agricola, Bochum, 62 S.
(28) Pawlik, M.; Haske, B.; Bernsdorf, B.; Rudolph, T. (2022): Mobile GIS as an innovative method for Geomonitoring of post-mining processes. GeoMinKöln 2022 (Poster).
(29) Pawlik, M.; Rudolph, T.; Bernsdorf, B. (2023): Analysis of changes of the vegetation condition on the area of the closed Prosper-Haniel mine in 1984 − 2021 using multispectral satellite images. IOP Conf. Ser.: Earth Environ. Sci. (In Press).