![]()
Based on data obtained by remote sensing techniques, this paper shows for the western part of the Campine coal basin that the average rates of residual subsidence and uplift are of the same order of magnitude in absolute terms. However, the spatial distributions of the residual subsidence values and the uplift values are different, and no correlation was observed between these two parameters. This information is useful in trying to understand the mechanisms that cause uplift. The flooding of the goaf most likely is not the only factor inducing the uplift. The paper has undergone a peer review process. It was held at the 30th SOMP Annual Meeting and Conference which took place from 29th June to 5th July 2019 at the TH Georg Agricola University in Bochum/Germany.
Introduction
All underground mining excavations result in certain impacts at the surface, especially when a total extraction method is being used without backfill. This is the case for the longwall mining method of deep coal seams in Europe. In the past, the companies that extracted the coal focused mainly on the short-term impact. This was based on the logic that the cumulative short-term impacts corresponded to subsidence values of several meters. However, the concepts of sustainable mining require the study of the long-term impact of mining on the surroundings, and previous research has shown clearly that there is a long-term impact on the movement of the surface. This could be residual subsidence, but the direction of movement can be reversed when the coal mines are closed and flooded. After flooding, clear uplifts have been observed that last several decades. The latter phenomenon has been documented well in different coal basins in Europe, e. g., the Netherlands (1, 2), Belgium (3, 4, 5, 6), Germany (7, 8), and France (8).

Fig. 1. Map of the Belgian Campine coal basin and the location of the five north-south transects selected for the analyses (9). The same colour code is used as in figure 4.
In this paper, we focused on the western part of the Belgian Campine basin (Figure 1) in northeastern Belgium (9). Three coal mines were active in that part of the basin (from west to east: the Beringen, Zolder, and Houthalen mines). Production at the Beringen mine stopped in 1990, and production stopped in 1992 at the Zolder-Houthalen mine. The underground pumping stations were dismantled and the shafts were closed in the years after production was terminated. This western part of the Campine basin was characterized by a period of additional residual subsidence that was followed by an uplift. In the eastern part of the Campine basin, the period of residual subsidence was much shorter (6). An earlier study showed that a residual downward movement occurred for the Houthalen coal mine until the end of 1999, followed by limited surface movement during the period of 2000 to 2004, and a clear uplift since 2005 (5). However, spatial variations were observed. In certain zones, e. g., the first annual upward movement already had occurred in 1995 to 1996, which was about three to four years after the closure of the underground infrastructure. Another conclusion in earlier studies was that the residual subsidence and uplift were in absolute terms of the same order of magnitude (4). Annual rates in the range of 5 to 15 mm were the most commonly observed. In certain areas, a total uplift of 0.5 m has been observed to date.
The (residual) subsidence and uplift are based on two different mechanisms. While subsidence is mainly a mechanical stress-deformation process linked to the caving and including time-dependent aspects, uplift is the result of the flooding of the deep underground areas (1, 2, 7, 8, 10). Several European researchers have claimed that uplift is a certain percentage of the short-term subsidence, or, in other words, that uplift is a type of rebound of part of the initial subsidence. The following is a quote from the Presidence report (10, p 19): “Four European sites of closed and flooded coal mines were selected in order to study the behaviour of the surface during and after the flooding phase: Limburg in Netherlands, Zwickau-Oelsnitz in Germany, Blanzy and Faulquemont in France. (…) The profile of ground level uplift is virtually congruent with that of subsidence, the point of maximum uplift correlating with the point of maximum subsidence. The uplift was 3 to 4 % of subsidence.” In this context, researchers often refer to the conclusion by the earliest study on this topic, i. e., the study conducted by Pöttgens, 1985 (11). However, Bekendam and Pöttgens, 1995 (1) nuance the relationship between subsidence and uplift, e. g., on page 8 they wrote: “Obviously a rough correlation exists between surface subsidence and uplift, but the uplift/subsidence ratio is varying considerably from point to point. The point of maximum subsidence (…) does not coincide with the point of maximum uplift (…). However, it should be noted that subsidence has been measured less accurately because at that time less levelling points were available. Generally the uplift is 2 to 4 % of the subsidence. Detailed profiles have shown that faults and locations of maximum horizontal extension are accompanied by a sudden “subsidence step” of up to 0.5 m at the surface. Irregularities of surface uplift have not been measured up to now (…).”
Earlier research for the Belgian Campine basin indicated that the shape for a north-south transect of uplift values can be approximated best by an inverse trough shape (4, 6). It also was noted that there was no correlation with the extent of the mining directly underneath. Rather, the amount of uplift is a function of the distance from the centre of the inverse trough shape. Generally, it can be assumed that the (residual) subsidence at a point is correlated to the amount of mining underneath this point and in the immediate vicinity. The aims of this paper are to focus specifically on the relationship between residual subsidence and uplift, and to determine whether a correlation exists between the two phenomena.
Radar interferometry data and the surface area studied
As explained above, taking the timing of closure and the subsequent periods of residual subsidence and uplift into account, the images of the European C-band ERS1/2 and ENVISAT-ASAR satellites were the most suitable. These data were acquired for research through a European Space Agency (ESA) research proposal (3). The periods that were recorded for the two sets were from August 1992 through December 2000 (87 cycles of 35 days) and from December 2003 through October 2010 (72 cycles of 35 days), respectively. Radar interferometry or Interferometry with Synthetic Aperture Radar (InSAR) is very suitable for studying large time series over large surface areas (12), as is the case for the study of surface movements within a coal basin. The movements of reflective surfaces – i. e., the so-called “permanent scatterers” – were followed during all of the successive cycles of the satellite. This allowed us to acquire high spatial coverage of the areas that were studied, at least if the area corresponded to a built environment. As will be seen further, unfortunately, this is not always the case for parts of the area under investigation. Some zones were composed of agricultural land, woodlands, and unused or semi-natural land. In comparison to conventional levelling techniques, the recorded movements corresponded to the reflection of a surface area of 4 x 20 m rather than a discrete point. The surface areas from which reflections were acquired generally were hardened surfaces, mainly the roofs of buildings. This means that the type and depth of the foundation and the structure itself affected the movement of the reflector. However, the disadvantages clearly were outweighed by the advantages, e. g., the frequency of measurement and the number of monitoring points. Other advantages were the facts that the satellite images were collected independent of the (past) mining company and that one can go back in the time. Even though the problem of uplift had been published earlier for the Dutch side of the same coal basin (11), there was no general knowledge of this phenomenon when the closures occurred in the 1987 to 1992 period. Hence, little or no attention was paid to this phenomenon, and, certainly, no conventional levelling campaigns at regular and short-time intervals were planned by the mining company after closure.
The area that has been mined in the Belgian part of the Campine basin corresponds approximately to an east-west zone with a length of about 60 km and a north-south width of 4 to 10 km (6, 9). One can consider the mined area as a relatively narrow east-west band. Hence, the largest spatial variations occurred in the north-south direction, as also was observed in earlier studies (4, 6). Therefore, the focus of this paper is on north-south transects. Five different central lines were considered, and all reflectors or permanent scatterers in a zone within ± 500 m of these central lines were selected. This buffer zone was a compromise between having sufficient data points and having limited scatter in the east-west direction.
A period of five years was selected for each dataset that was recorded. The comparison between the two datasets was facilitated by selecting the same time length. The first five-year period (from August 1992 through August 1997) was selected for the first dataset, and the last five-year period (from October 2005 through October 2010) was selected for the second dataset. The reason for selecting these two periods of five years was that only a pure downward movement occurred in the first five-year period, while the second five-year period was characterised by pure uplift. Between the years 1997 and 2005, there could have been zones in which there was either still residual subsidence, limited movement, or uplift.
Analyses of the surface movements that were recorded
Five transects were selected for the analyses. They were spread along the western part of the Belgian Campine basin over a total east-west width of about 12 km (Figure 1). The selection was determined mainly by the need to have adequate numbers of reflectors distributed evenly throughout the zones that were considered. The first transect (the most eastern transect; green north-south line in figure 1) is discussed in detail, followed by the presentation of the average values of the other four transects. For all transects, the origin of the north-south horizontal distance was the southern limit of the exploitation of the mine within that transect, also indicated by a square dotted line in figures 2 and 3. The northern limit is indicated by a second square dotted line. The data for the same north-south length, i. e., 15 km, are presented in the various graphs. This length includes 5 km to the south of the southern limit, the length of exploitation between both limits, and about 4 to 6 km to the north of the northern limit.
Analyses of the first transect
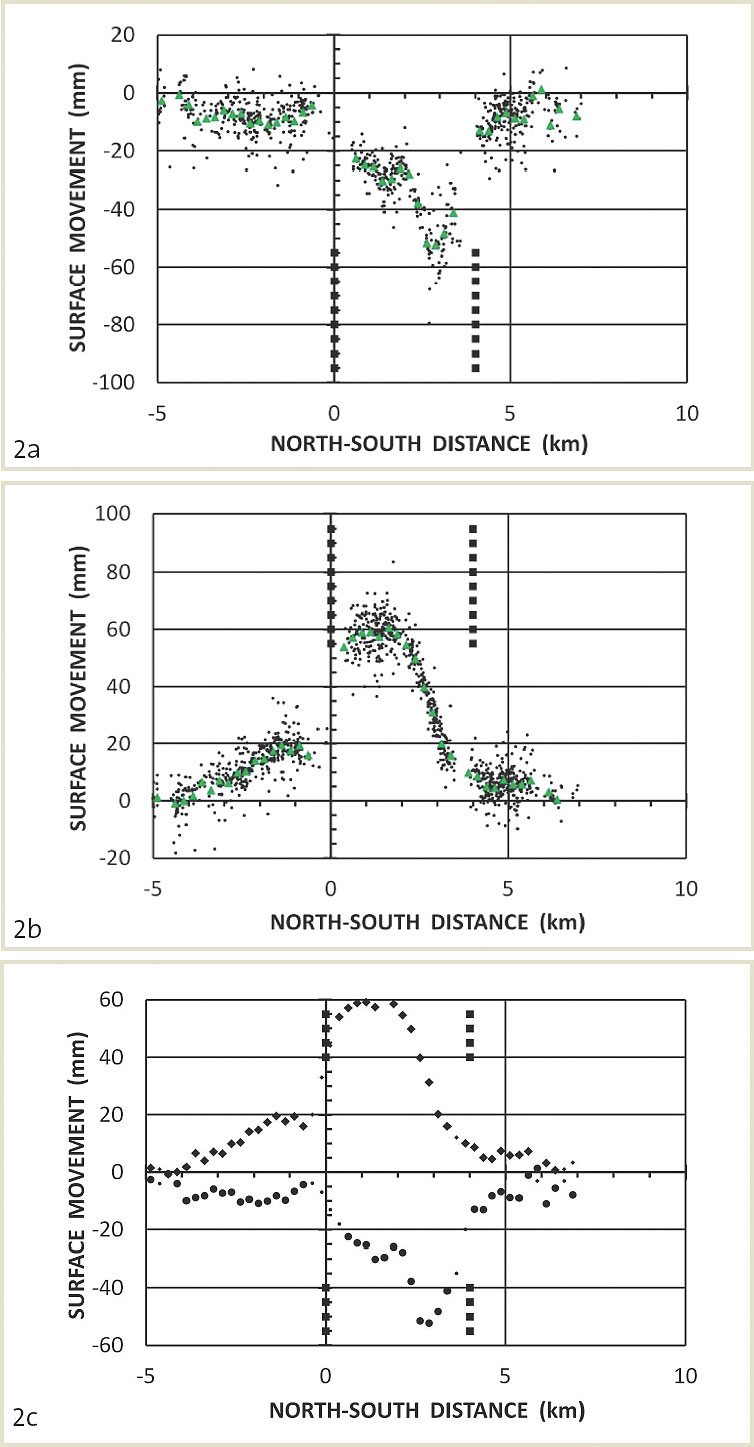
Fig. 2. Total surface movement along a 15 km north-south transect for a five-year period of all reflectors within the considered zone: a) Residual subsidence from August 1992 through August 1997; b) Uplift from October 2005 through October 2010; c) Average values (indicated in green on previous graphs) for both periods. The limits of the exploitation are indicated by square dotted lines.
In figure 2a, the total amount of additional subsidence in the first five-year period (from August 1992 onwards) is presented for all reflectors. At the horizontal distances around 0 and 3.75 km, either no reflectors or a very small number of them were present. The total north-south length of mining was 4 km. Although there was a variation in the minimum and maximum values for a certain horizontal distance, an overall maximum was observed at a distance of about 2.5 to 3 km. The largest individual value was – 79.5 mm, corresponding to an annual rate of – 16 mm. For each 250 m interval, an average of all reflectors in this interval was calculated if at least five or more reflectors were present. For the zone of maximum residual subsidence, the averages were in the range of – 48 to – 52 mm, corresponding to an annual rate of about – 10 mm. Over the first 2 km of the mined zone, the average residual subsidence was – 30 mm (– 6 mm/a) or less for the five-year period. For horizontal distances between 0 and 1.75 km, most panels were mined in the 1950s and early 1960s. For the additional distances to the north (up to 3 km), there was always a panel that was mined in the early 1970s. This could explain, at least partly, the shape of the residual subsidence. However, in the last 500 m of the exploitation zone, a single panel with a mining height of 2.7 m was mined in 1990.
More to the south and more to the north than both limits of mining, average residual subsidence values of – 5 to – 13 mm were observed. Usually, an accuracy of about 1 mm/a is assumed, which would mean that the observed values were significant, but the most important observation was that there was a larger movement and a clear maximum within the mined zone.
Figure 2b shows the total amount of uplift in the last five-year period of the second set of satellite images (until October 2010). As is the case for all images, more reflectors were identified by the ENVISAT-ASAR satellite than by the C-band ERS1/2 satellite, but either no reflectors or only a few reflectors were observed at the horizontal distances around 0 and 3.75 km. In absolute terms, we observed the same order of magnitude for the movement as was observed for the residual subsidence. This observation is in agreement with earlier observations (4). In comparison to the graph for residual subsidence, the maximum uplift was observed around a distance of 0.75 to 2 km. The average values of uplift in this zone were about 60 mm, which equates to an annual average rate of 12 mm during the five-year period. For a distance of about 3 km – where the maximum residual subsidence occurred – the uplift was about 30 mm or an average annual rate of 6 mm. In particular to the south of the southern limit of exploitation, the zone of influence seemed to be about 3 to 4 km. Close to that limit, the mining depths were situated between 643 and 699 m. In other words, the zone of influence would be four to six times the mining depth.
As mentioned above, an average was calculated of all reflectors within an interval of 250 m when five or more reflectors were present. A disadvantage of this method is that fluctuations sometimes are observed in the average curve, but they have no real meaning. However, this method is preferred over some other techniques to present smoothed curves, e. g., moving averages. The reason is that such techniques could result in the loss of certain discontinuities in the curves. In other words, a trade-off must be made between observing fluctuations that have no meaning and loosing information due to smoothing. Figure 2c shows the average values for both periods in a single graph. When no average could be calculated, the most likely value was estimated, and these values are indicated by small dots.
Analyses of four additional transects
Figure 2 provided information about the most eastern transect that was considered. Figure 3 shows the four other transects from east to west. Only the average values are presented, but the variation between individual reflectors was similar, as indicated in Figures 2a and 2b. The first observation again is that the residual subsidence and the uplift for these four additional transects over a five-year period were of the same order of magnitude. Within the mining limits, average movements in absolute terms of about 20 to 60 mm were observed over the five-year periods, corresponding to an average of 4 to 12 mm/a. Towards the limits of the exploitation, the amount of movement decreased, but the zone of influence clearly extended beyond the limits for most cases. There seems to be no zone of influence beyond the exploitation limit for the southern limit of the transect presented in figure 3d. Next to the southern limit, a single seam with a total mining height of 2.7 m was excavated at a depth of 693 m. Such a high opening is relatively rare in the Campine basin. For all other cases, the zone of influence extended from 1 to 3 km outside the limits of the exploitation, as well to the south and the north.
The shapes of the curves in figure 3a are very similar to the shapes of the curves in figure 2. The east-west distance between both transects was about 1.1 km. For the transect of figure 3a, the maximum in the curve of residual subsidence was close to the northern limit (at a distance of 0.5 to 1.5 km from this limit), while the maximum for the uplift was close to the southern limit (at a distance of 1 to 2 km from this limit). The same is true for figure 3d, but, in this transect, the maximum in the curve of uplift was more centrally situated. The north-south distance between the two limits of mining was 4.75 km, and the maximum uplift was situated at 2 to 2.75 km from the southern limit, as from the northern limit.
In the curve of the residual subsidence of figures 3b and 3c, there seems to be two peaks. It also is the case in the curve of the uplift in figure 3b, but not in figure 3c. The reason two peaks were observed most probably was linked to the absence of mining within the exploitation zone over a significant distance. For figure 3b, no mining occurred between the distances of 1 to 3 km from the southern limit. For figure 3c, the zone without mining was between 2.5 and 3.5 km from the southern limit. The reason for the absence of mining was linked to the presence of many faults. All of this probably means that the local decreases in the curves are similar to the decrease in the movement towards the external limits of mining.
Discussion of results
Earlier research has shown that curves of the uplift values along a north-south transect could be best described as an inverse trough shape with a maximum close to the central part (4, 6). By analysing more north-south transects, this finding has to be nuanced. The example presented in figure 3d clearly confirms the earlier finding. The examples of figures 2, 3a, and 3c also show a single maximum in the curve, but it is situated closer to the southern exploitation limit than the centre of the mined zone. Additional investigation is needed to determine whether this is linked to the dipping of the seams towards the N-NE. The curve of the uplift values presented in figure 3b contains two maxima. The most logical explanation is that, between the maxima, there is a zone that is about 2 km long (in the north-south direction) in which there is no mining. This zone contains several faults, and it was considered to be unsuitable for mining. The main tunnels were dug through this zone, but no mining panels were excavated.
Although the focus of the overall research is on the process of uplift, it is interesting to compare the amount of uplift to the residual subsidence. Overall, one could assume that there should be a link between the residual subsidence and the original short-term subsidence. Unfortunately, either no data or limited data are available publically for these case studies on the short-term subsidence values, and no data at all are available on the cumulative amount of subsidence since the initiation of coal mining in the first half of the 20th century. The production of the Beringen coal mine began in 1922, and that of the Zolder and Houthalen coal mines began in 1930 and 1939, respectively. In three out of the five transects (Figures 2, 3a, and 3d), clear maxima are observed in the curves of the residual subsidence. For these three cases, the maxima are close to the northern limit of mining, i. e., at a distance of 0.5 to 1.5 km from this limit. As mentioned earlier, the mined seams are deeper towards the north due to the dipping of the layers. For the transect of figure 2a, there also could be a link with the time since the last mining. Around the maximum in residual subsidence, some panels were mined in the early 1970s, which was not the case more to the south. However, the mining in the early 1970s was still 20 years or more before the mine was closed. Just south of the northern exploitation limit, a panel was mined in 1990, which was only two years before closure and the initiation of recording data. For the transect of figure 3a, there is a similar link with the time since the last mining. For the horizontal distances between 3.25 and 4.75 km, corresponding to the larger residual subsidence values, the most recent panels were mined between 1979 and 1992. More to the south, the mining took place between 1941 and 1963. For the three transects more to the west, no reliable data are available on the year of mining for each panel. For the curves of the residual subsidence in figures 3c and 3d, two maxima are observed. The most logical explanation is that lower residual subsidence values generally are recorded above the zones without any mining.
In general terms, one can conclude that, above the mined out area, larger absolute values are observed for both the residual subsidence and the uplift. However, the shapes of the two curves are different. Towards the limits, both curves approach zero, but, in most cases, this value is reached only beyond the limits. In some cases, the zone of influence reaches 3 to 4 km, which corresponds to four to six times the depth of the deepest panel. To further quantify the link between the residual subsidence and the uplift, the two parameters were plotted against each other (Figure 4). Taking previous conclusions into account, the dataset is split up into a first group that includes all locations above the mined zone and excludes the first and last 750 m (Figure 4a) and a second group with locations around the north and south exploitation limits (Figure 4b). The width of 750 m was considered both inside and outside the exploitation limits. Figure 4a clearly shows that the values that correspond to the locations that were considered look like a cloud of points. One cannot conclude that a large absolute residual subsidence corresponds to a large uplift.
All pairs of average residual subsidence (negative values) and uplift values (positive values) for the five zones above the exploitation lead to a correlation coefficient of 0.13. This coefficient is close to zero and is positive. A perfect correlation between a negative residual subsidence value and a positive uplift value would result in a coefficient equal to – 1. For the values excluding the first and last 750 m above the mined zones (points presented in figure 4a), the correlation coefficient remains small and it is a bit more positive. A value of 0.26 is calculated, which indicates that, if there is a correlation, a large negative value of residual subsidence would result in a small positive uplift value rather than a large value. For the five individual transects presented in figure 4a, the correlation coefficients from east to west are 0.90, 0.89, – 0.07, – 0.45, and – 0.19, respectively. For the two transects most to the east, a large positive value of the coefficient is calculated. This is the translation of what was concluded for figures 2c and 3a, i. e., the maximum absolute values for residual subsidence and for uplift are situated at different locations.
For the locations around the limits (Figure 4b), some lines of points can be observed for individual transects with negative slope. A correlation coefficient of – 0.28 is calculated for all pairs in the five transects together. It is a small value, but it is negative in comparison to the central zones. For the individual transects, the correlation coefficients vary between 0.15 and – 0.87, and, from east to west, the values are – 0.02, 0.15, – 0.82, – 0.87 and – 0.72, respectively. As explained above, this cannot be considered to be a real correlation between the two phenomena; rather, it is the effect of the sides of the zone that was mined. Towards the borders and certainly beyond them, the effects of both phenomena disappear, so this should be considered as a pseudo-correlation.
Conclusions
The data collected by radar interferometry above the western part of the Belgian Campine coal basin show that there is no direct correlation between the uplift after flooding and the residual subsidence due to the longwall mining. In general terms, it was concluded that larger absolute values of both residual subsidence and uplift could be observed above the mined out area. However, the shapes of the two curves were different. Towards the limits, both curves approached zero, but, in most cases, this value was only reached beyond the limits. In some cases, the zone of influence reached 3 to 4 km, which was four to six times the mining depth.
The findings presented in this paper confirm the original findings of Pöttgens, 1985 (11) and Bekendam and Pöttgens, 1995 (1) above the Dutch coal mines. They only referred to a rough correlation between surface subsidence and uplift, and they stated clearly that the point of maximum subsidence does not coincide with the point of maximum uplift. The latter also was clearly the case for the various transects presented in this paper, which were located in the western part of the Campine coal basin where the Beringen, Zolder, and Houthalen coal mines were located. Also, it can be concluded that, in absolute terms, the rate of movement was similar for the phase of residual subsidence, as for the phase of uplift. Bekendam & Pöttgens, 1995 (1) concluded that, in general, the uplift was 2 to 4 % of the subsidence. For the sites presented in this paper, this cannot be confirmed or denied. First, there are no public data available for the original subsidence, and the impact of mining on the surface in the first half of the 20th century was not monitored in detail. Second, it is not clear when the uplift phase will stop. Recent data show that upwards movement is still occurring even though it has been 30 years since the mining was terminated.
All of this information is extremely useful in trying to understand the mechanisms of uplift. For other coal basins, it has been shown clearly that there is a direct link between the flooding of the underground and the uplift observed at the surface. However, the lack of a correlation between residual subsidence and uplift could indicate that the flooding of the goaf has a less significant role in the uplift process, as generally assumed. In other words, the goaf most likely is not the only factor inducing the uplift.
References
References
(1) Bekendam, R. F.; Pöttgens, J. J. (1995): Ground movements over the coal mines of southern Limburg, The Netherlands, and their relation to rising mine waters. In: Proc. 5th Int. Symp. on Land Subsidence, The Hague/The Netherlands, IAHS, 234: pp 3 – 12.
(2) Caro Cuenca, M.; Hooper, A. J.; Hanssen, R. F. (2013): Surface deformation induced by water influx in the abandoned coal mines in Limburg, The Netherlands observed by satellite radar interferometry. In: J. of Appl. Geophysics, 88: pp 1 – 11.
(3) Devleeschouwer, X.; Declercq, P. Y.; Flamion, B.; Brixko, J.; Timmermans, A.; Vanneste, J. (2008): Uplift revealed by radar interferometry around Liège (Belgium): A relation with rising mining groundwater. In: Proc. Post-Mining 2008, Nancy/France, GISOS, 13 pages.
(4) Vervoort, A. (2016): Surface movement above an underground coal longwall mine after closure. In: Nat. Hazards Earth Syst. Sci., 16: pp 2107 – 2121.
(5) Vervoort, A.; Declercq, P. Y. (2017): Surface movement above old coal longwalls after mine closure. In: Int. J. of Min. Sc. and Techn., 27(3): pp 481 – 490.
(6) Vervoort, A.; Declercq, P. Y. (2018): Upward surface movement above deep coal mines after closure and flooding of underground workings. In: Int. J. of Min. Sc. and Techn., 28: pp 53 – 59.
(7) Baglikow, V. (2011): Schadensrelevante Auswirkungen des Grubenwasseranstiegs – Erkenntnisse aus dem Erkelenzer Steinkohlenrevier. In: Markscheidewesen, 118(2): S. 10 – 16.
(8) Samsonov, S.; d’Oreye, N.; Smets, B. (2013): Ground deformation associated with post-mining activity at the French-German border revealed by novel InSAR time series method. In: Int. J. of Appl. Earth Obs. and Geoinformation, 23: pp 142 – 154.
(9) Van Tongeren, P.; Dreesen, R. (2004): Residual space volumes in abandoned coal mines of the Belgian Campine basin and possibilities for use. In: Geologica Belgica, 7/3-4: pp 157 – 164.
(10) Herrero, C.; Muñoz, A.; Catalina, J. C.; Hadj-Hassen, F.; Kuchenbecker, R.; Spreckels, V.; Juzwa, J.; Bennett, S.; Purvis, M.; Bigby, D.; Moore, D. (2012): Prediction and monitoring of subsidence hazards above coal mines (Presidence). RFCS Final Report RFCR-CT-2007-00004, EUR 25057 EN, Brussels, Belgium: European Commission, 131 pages.
(11) Pöttgens, J. J. (1985): Uplift as a result of rising mine waters. In: The Development Science and Art of Minerals Surveying. Proc. 6th Int. Congr. Int. Soc. For Mine Surveying, Harrogate, UK, 2: pp 928 – 938.
(12) Goerke-Mallet, P.; Melchers, C.; Müterthies, A. (2017): Innovative monitoring measures in the phase of post-mining. In: Mining Report Glückauf (153), Heft 3, S. 264 – 271.